Immigrants from Zimbabwe vs Carpatho Rusyn In Labor Force | Age 20-24
COMPARE
Immigrants from Zimbabwe
Carpatho Rusyn
In Labor Force | Age 20-24
In Labor Force | Age 20-24 Comparison
Immigrants from Zimbabwe
Carpatho Rusyns
75.9%
IN LABOR FORCE | AGE 20-24
95.1/ 100
METRIC RATING
114th/ 347
METRIC RANK
76.5%
IN LABOR FORCE | AGE 20-24
99.4/ 100
METRIC RATING
83rd/ 347
METRIC RANK
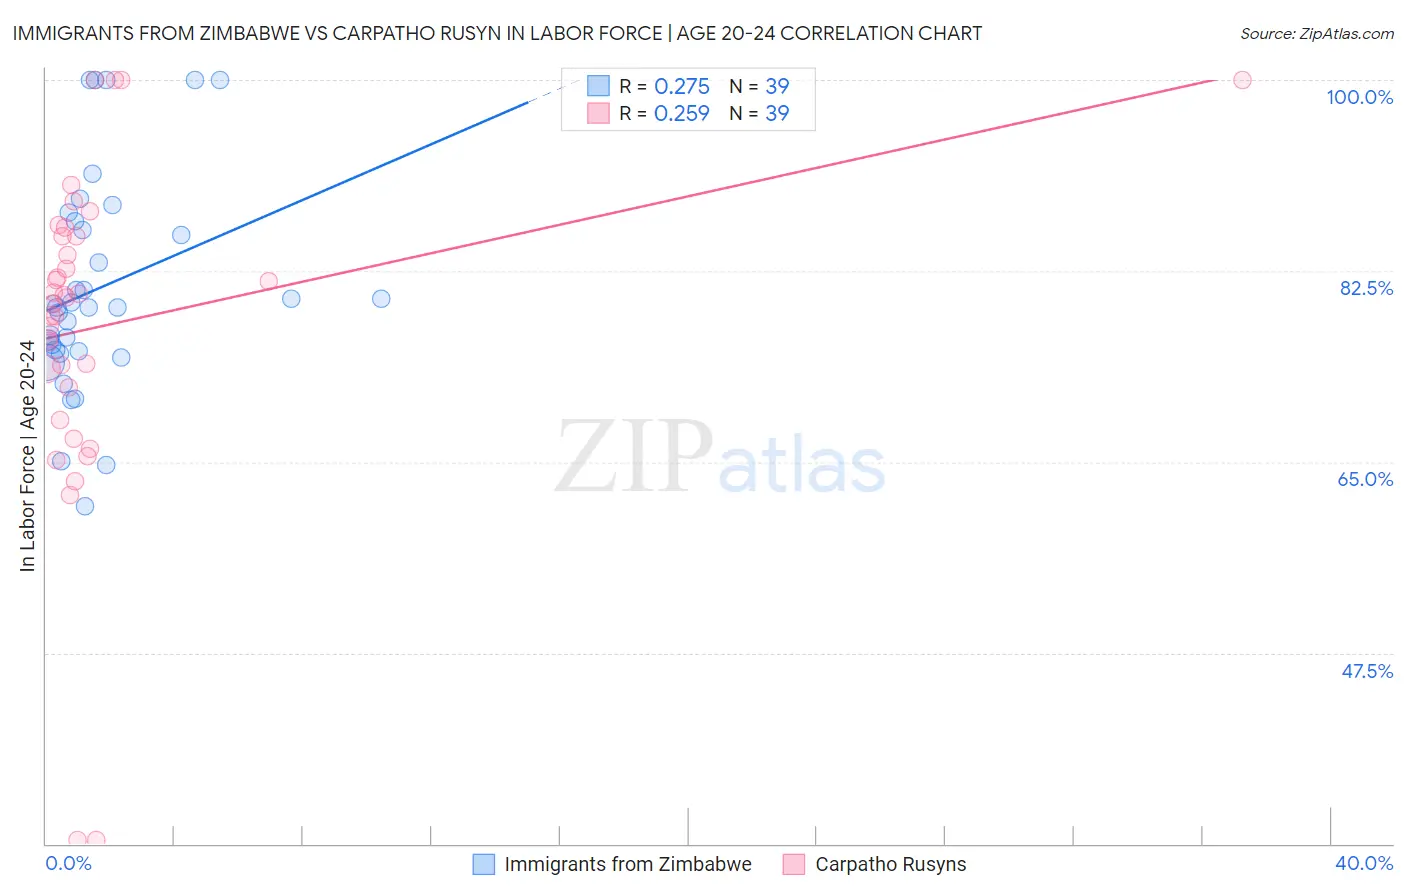
Immigrants from Zimbabwe vs Carpatho Rusyn In Labor Force | Age 20-24 Correlation Chart
The statistical analysis conducted on geographies consisting of 117,807,327 people shows a weak positive correlation between the proportion of Immigrants from Zimbabwe and labor force participation rate among population between the ages 20 and 24 in the United States with a correlation coefficient (R) of 0.275 and weighted average of 75.9%. Similarly, the statistical analysis conducted on geographies consisting of 58,856,005 people shows a weak positive correlation between the proportion of Carpatho Rusyns and labor force participation rate among population between the ages 20 and 24 in the United States with a correlation coefficient (R) of 0.259 and weighted average of 76.5%, a difference of 0.78%.
In Labor Force | Age 20-24 Correlation Summary
| Measurement | Immigrants from Zimbabwe | Carpatho Rusyn |
| Minimum | 60.9% | 30.4% |
| Maximum | 100.0% | 100.0% |
| Range | 39.1% | 69.6% |
| Mean | 81.0% | 77.5% |
| Median | 79.2% | 80.0% |
| Interquartile 25% (IQ1) | 75.2% | 71.9% |
| Interquartile 75% (IQ3) | 87.0% | 85.7% |
| Interquartile Range (IQR) | 11.9% | 13.8% |
| Standard Deviation (Sample) | 9.9% | 14.9% |
| Standard Deviation (Population) | 9.7% | 14.7% |
Similar Demographics by In Labor Force | Age 20-24
Demographics Similar to Immigrants from Zimbabwe by In Labor Force | Age 20-24
In terms of in labor force | age 20-24, the demographic groups most similar to Immigrants from Zimbabwe are Alaska Native (75.9%, a difference of 0.0%), Immigrants from Netherlands (75.9%, a difference of 0.010%), Immigrants from North America (75.9%, a difference of 0.010%), Assyrian/Chaldean/Syriac (75.9%, a difference of 0.020%), and Spanish American (75.8%, a difference of 0.020%).
| Demographics | Rating | Rank | In Labor Force | Age 20-24 |
| Greeks | 96.9 /100 | #107 | Exceptional 76.0% |
| Iraqis | 96.6 /100 | #108 | Exceptional 76.0% |
| Cherokee | 95.8 /100 | #109 | Exceptional 75.9% |
| Immigrants | Morocco | 95.8 /100 | #110 | Exceptional 75.9% |
| Ukrainians | 95.7 /100 | #111 | Exceptional 75.9% |
| Immigrants | Canada | 95.6 /100 | #112 | Exceptional 75.9% |
| Immigrants | Netherlands | 95.3 /100 | #113 | Exceptional 75.9% |
| Immigrants | Zimbabwe | 95.1 /100 | #114 | Exceptional 75.9% |
| Alaska Natives | 95.1 /100 | #115 | Exceptional 75.9% |
| Immigrants | North America | 95.0 /100 | #116 | Exceptional 75.9% |
| Assyrians/Chaldeans/Syriacs | 94.9 /100 | #117 | Exceptional 75.9% |
| Spanish Americans | 94.8 /100 | #118 | Exceptional 75.8% |
| Immigrants | Portugal | 94.8 /100 | #119 | Exceptional 75.8% |
| Immigrants | Africa | 94.6 /100 | #120 | Exceptional 75.8% |
| Immigrants | Serbia | 94.3 /100 | #121 | Exceptional 75.8% |
Demographics Similar to Carpatho Rusyns by In Labor Force | Age 20-24
In terms of in labor force | age 20-24, the demographic groups most similar to Carpatho Rusyns are Austrian (76.5%, a difference of 0.010%), Portuguese (76.4%, a difference of 0.040%), Immigrants from Iraq (76.4%, a difference of 0.060%), Immigrants from Thailand (76.4%, a difference of 0.060%), and Basque (76.5%, a difference of 0.090%).
| Demographics | Rating | Rank | In Labor Force | Age 20-24 |
| Immigrants | Moldova | 99.6 /100 | #76 | Exceptional 76.6% |
| Immigrants | Cameroon | 99.6 /100 | #77 | Exceptional 76.6% |
| Canadians | 99.6 /100 | #78 | Exceptional 76.6% |
| Immigrants | Zaire | 99.6 /100 | #79 | Exceptional 76.6% |
| Italians | 99.6 /100 | #80 | Exceptional 76.5% |
| Basques | 99.5 /100 | #81 | Exceptional 76.5% |
| Hmong | 99.5 /100 | #82 | Exceptional 76.5% |
| Carpatho Rusyns | 99.4 /100 | #83 | Exceptional 76.5% |
| Austrians | 99.4 /100 | #84 | Exceptional 76.5% |
| Portuguese | 99.3 /100 | #85 | Exceptional 76.4% |
| Immigrants | Iraq | 99.3 /100 | #86 | Exceptional 76.4% |
| Immigrants | Thailand | 99.3 /100 | #87 | Exceptional 76.4% |
| Spanish | 99.2 /100 | #88 | Exceptional 76.4% |
| Bulgarians | 99.2 /100 | #89 | Exceptional 76.4% |
| Immigrants | Burma/Myanmar | 99.1 /100 | #90 | Exceptional 76.3% |