Apache vs Carpatho Rusyn In Labor Force | Age 20-24
COMPARE
Apache
Carpatho Rusyn
In Labor Force | Age 20-24
In Labor Force | Age 20-24 Comparison
Apache
Carpatho Rusyns
72.0%
IN LABOR FORCE | AGE 20-24
0.0/ 100
METRIC RATING
311th/ 347
METRIC RANK
76.5%
IN LABOR FORCE | AGE 20-24
99.4/ 100
METRIC RATING
83rd/ 347
METRIC RANK
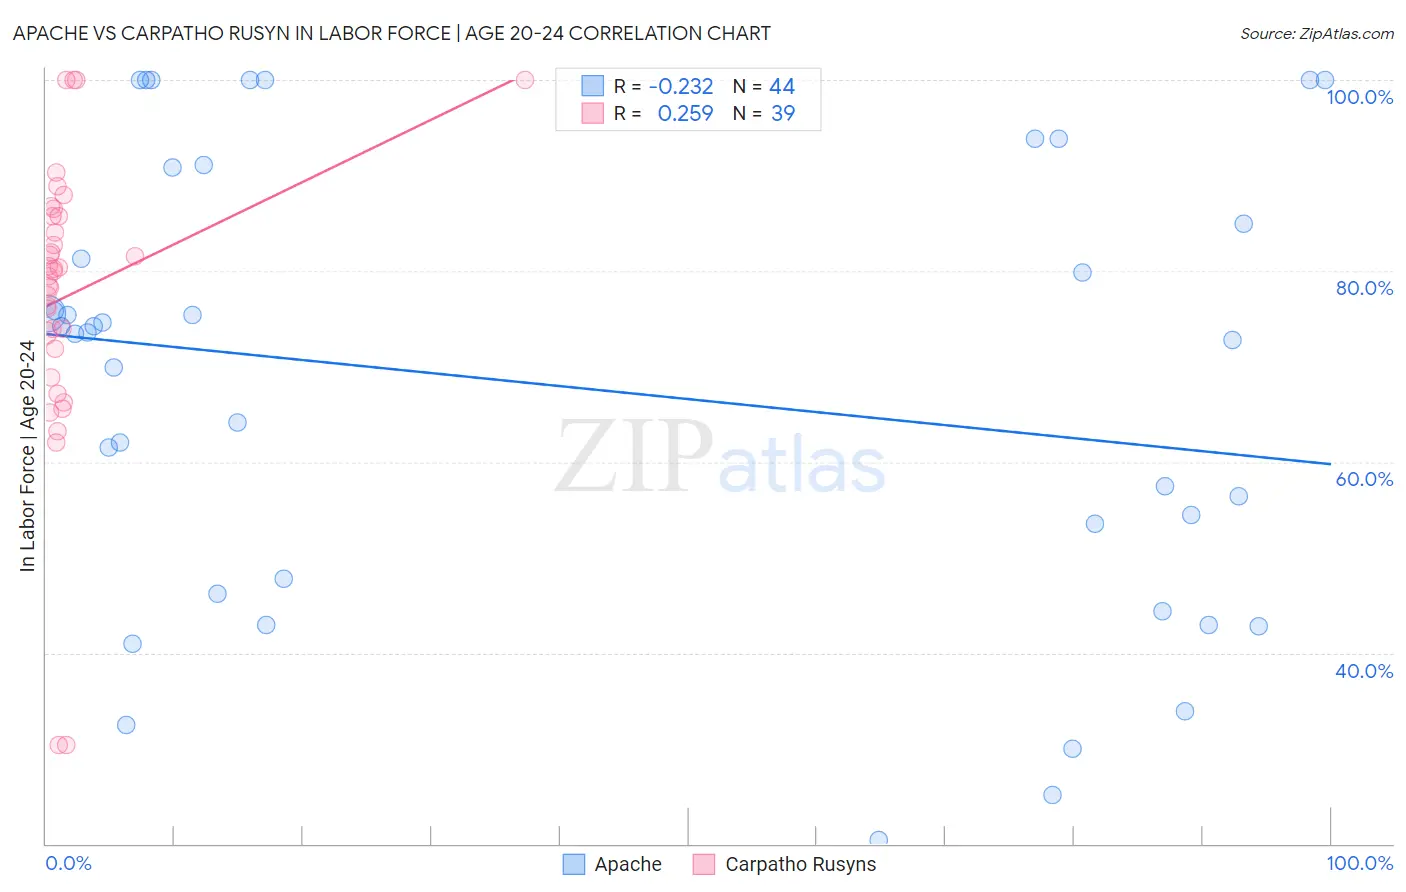
Apache vs Carpatho Rusyn In Labor Force | Age 20-24 Correlation Chart
The statistical analysis conducted on geographies consisting of 231,058,831 people shows a weak negative correlation between the proportion of Apache and labor force participation rate among population between the ages 20 and 24 in the United States with a correlation coefficient (R) of -0.232 and weighted average of 72.0%. Similarly, the statistical analysis conducted on geographies consisting of 58,856,005 people shows a weak positive correlation between the proportion of Carpatho Rusyns and labor force participation rate among population between the ages 20 and 24 in the United States with a correlation coefficient (R) of 0.259 and weighted average of 76.5%, a difference of 6.2%.
In Labor Force | Age 20-24 Correlation Summary
| Measurement | Apache | Carpatho Rusyn |
| Minimum | 20.4% | 30.4% |
| Maximum | 100.0% | 100.0% |
| Range | 79.6% | 69.6% |
| Mean | 67.9% | 77.5% |
| Median | 73.5% | 80.0% |
| Interquartile 25% (IQ1) | 47.0% | 71.9% |
| Interquartile 75% (IQ3) | 87.9% | 85.7% |
| Interquartile Range (IQR) | 40.9% | 13.8% |
| Standard Deviation (Sample) | 23.3% | 14.9% |
| Standard Deviation (Population) | 23.1% | 14.7% |
Similar Demographics by In Labor Force | Age 20-24
Demographics Similar to Apache by In Labor Force | Age 20-24
In terms of in labor force | age 20-24, the demographic groups most similar to Apache are Immigrants from Cuba (72.0%, a difference of 0.010%), Immigrants from Caribbean (71.9%, a difference of 0.070%), Immigrants from Dominica (71.9%, a difference of 0.12%), Indian (Asian) (71.9%, a difference of 0.13%), and Immigrants from Iran (71.8%, a difference of 0.22%).
| Demographics | Rating | Rank | In Labor Force | Age 20-24 |
| Immigrants | West Indies | 0.0 /100 | #304 | Tragic 72.4% |
| Immigrants | Singapore | 0.0 /100 | #305 | Tragic 72.4% |
| Immigrants | Jamaica | 0.0 /100 | #306 | Tragic 72.4% |
| Immigrants | Ecuador | 0.0 /100 | #307 | Tragic 72.3% |
| Soviet Union | 0.0 /100 | #308 | Tragic 72.3% |
| Tsimshian | 0.0 /100 | #309 | Tragic 72.3% |
| Immigrants | Cuba | 0.0 /100 | #310 | Tragic 72.0% |
| Apache | 0.0 /100 | #311 | Tragic 72.0% |
| Immigrants | Caribbean | 0.0 /100 | #312 | Tragic 71.9% |
| Immigrants | Dominica | 0.0 /100 | #313 | Tragic 71.9% |
| Indians (Asian) | 0.0 /100 | #314 | Tragic 71.9% |
| Immigrants | Iran | 0.0 /100 | #315 | Tragic 71.8% |
| Immigrants | Eastern Asia | 0.0 /100 | #316 | Tragic 71.8% |
| Immigrants | Armenia | 0.0 /100 | #317 | Tragic 71.7% |
| Immigrants | Hong Kong | 0.0 /100 | #318 | Tragic 71.6% |
Demographics Similar to Carpatho Rusyns by In Labor Force | Age 20-24
In terms of in labor force | age 20-24, the demographic groups most similar to Carpatho Rusyns are Austrian (76.5%, a difference of 0.010%), Portuguese (76.4%, a difference of 0.040%), Immigrants from Iraq (76.4%, a difference of 0.060%), Immigrants from Thailand (76.4%, a difference of 0.060%), and Basque (76.5%, a difference of 0.090%).
| Demographics | Rating | Rank | In Labor Force | Age 20-24 |
| Immigrants | Moldova | 99.6 /100 | #76 | Exceptional 76.6% |
| Immigrants | Cameroon | 99.6 /100 | #77 | Exceptional 76.6% |
| Canadians | 99.6 /100 | #78 | Exceptional 76.6% |
| Immigrants | Zaire | 99.6 /100 | #79 | Exceptional 76.6% |
| Italians | 99.6 /100 | #80 | Exceptional 76.5% |
| Basques | 99.5 /100 | #81 | Exceptional 76.5% |
| Hmong | 99.5 /100 | #82 | Exceptional 76.5% |
| Carpatho Rusyns | 99.4 /100 | #83 | Exceptional 76.5% |
| Austrians | 99.4 /100 | #84 | Exceptional 76.5% |
| Portuguese | 99.3 /100 | #85 | Exceptional 76.4% |
| Immigrants | Iraq | 99.3 /100 | #86 | Exceptional 76.4% |
| Immigrants | Thailand | 99.3 /100 | #87 | Exceptional 76.4% |
| Spanish | 99.2 /100 | #88 | Exceptional 76.4% |
| Bulgarians | 99.2 /100 | #89 | Exceptional 76.4% |
| Immigrants | Burma/Myanmar | 99.1 /100 | #90 | Exceptional 76.3% |