Mexican vs Swiss In Labor Force | Age 30-34
COMPARE
Mexican
Swiss
In Labor Force | Age 30-34
In Labor Force | Age 30-34 Comparison
Mexicans
Swiss
81.9%
IN LABOR FORCE | AGE 30-34
0.0/ 100
METRIC RATING
312th/ 347
METRIC RANK
84.3%
IN LABOR FORCE | AGE 30-34
5.8/ 100
METRIC RATING
219th/ 347
METRIC RANK
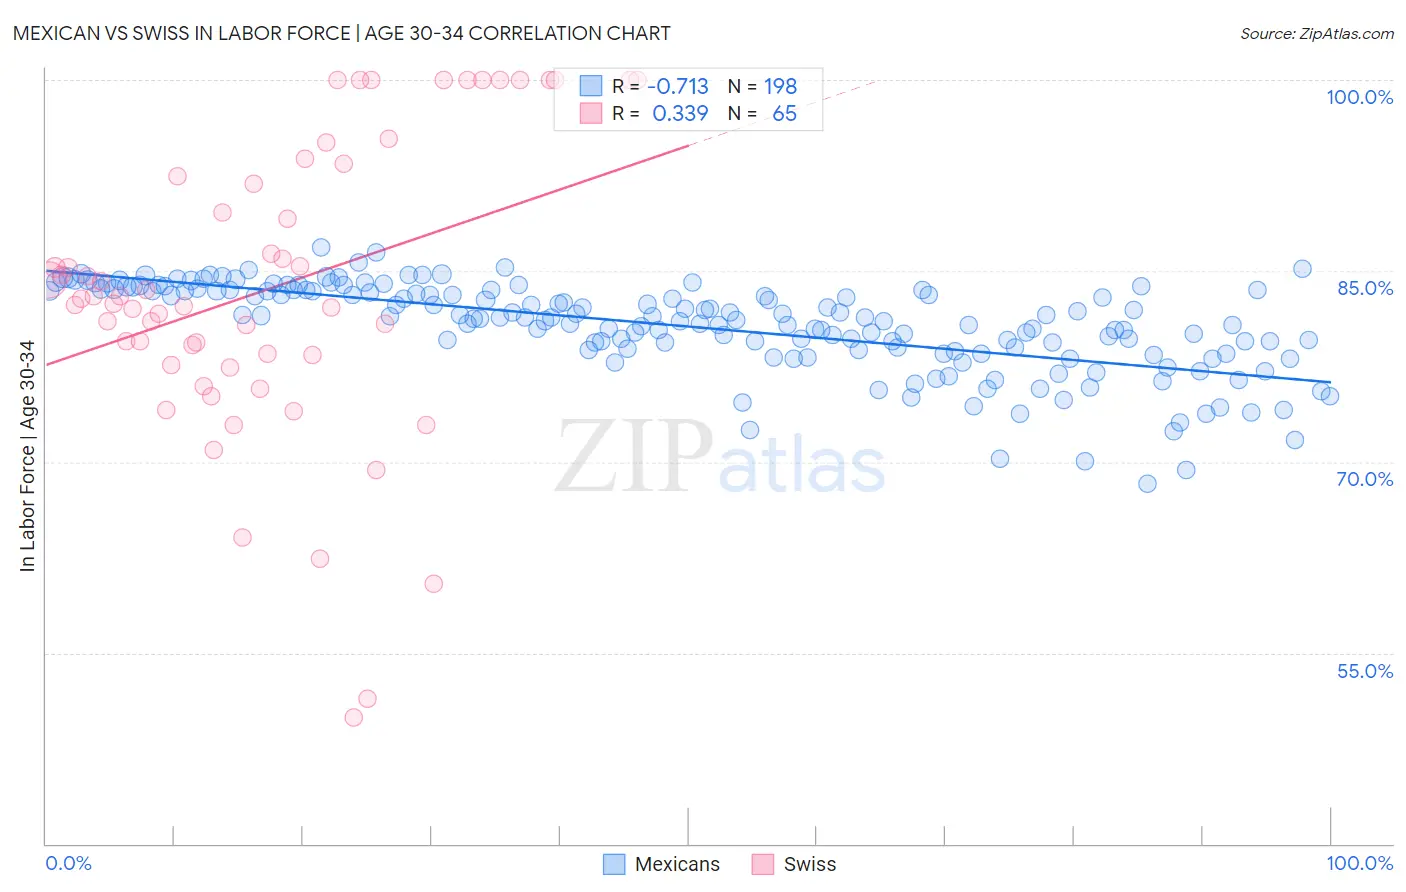
Mexican vs Swiss In Labor Force | Age 30-34 Correlation Chart
The statistical analysis conducted on geographies consisting of 564,037,152 people shows a strong negative correlation between the proportion of Mexicans and labor force participation rate among population between the ages 30 and 34 in the United States with a correlation coefficient (R) of -0.713 and weighted average of 81.9%. Similarly, the statistical analysis conducted on geographies consisting of 464,594,297 people shows a mild positive correlation between the proportion of Swiss and labor force participation rate among population between the ages 30 and 34 in the United States with a correlation coefficient (R) of 0.339 and weighted average of 84.3%, a difference of 2.9%.
In Labor Force | Age 30-34 Correlation Summary
| Measurement | Mexican | Swiss |
| Minimum | 68.3% | 49.9% |
| Maximum | 86.8% | 100.0% |
| Range | 18.5% | 50.1% |
| Mean | 80.7% | 83.6% |
| Median | 81.3% | 82.8% |
| Interquartile 25% (IQ1) | 78.8% | 78.0% |
| Interquartile 75% (IQ3) | 83.5% | 93.0% |
| Interquartile Range (IQR) | 4.6% | 15.0% |
| Standard Deviation (Sample) | 3.5% | 11.7% |
| Standard Deviation (Population) | 3.5% | 11.6% |
Similar Demographics by In Labor Force | Age 30-34
Demographics Similar to Mexicans by In Labor Force | Age 30-34
In terms of in labor force | age 30-34, the demographic groups most similar to Mexicans are Chickasaw (81.9%, a difference of 0.0%), Iroquois (81.9%, a difference of 0.020%), Cajun (82.0%, a difference of 0.050%), Immigrants from Mexico (82.0%, a difference of 0.070%), and Puget Sound Salish (82.1%, a difference of 0.24%).
| Demographics | Rating | Rank | In Labor Force | Age 30-34 |
| Osage | 0.0 /100 | #305 | Tragic 82.3% |
| Spanish American Indians | 0.0 /100 | #306 | Tragic 82.2% |
| Menominee | 0.0 /100 | #307 | Tragic 82.2% |
| Puget Sound Salish | 0.0 /100 | #308 | Tragic 82.1% |
| Immigrants | Mexico | 0.0 /100 | #309 | Tragic 82.0% |
| Cajuns | 0.0 /100 | #310 | Tragic 82.0% |
| Chickasaw | 0.0 /100 | #311 | Tragic 81.9% |
| Mexicans | 0.0 /100 | #312 | Tragic 81.9% |
| Iroquois | 0.0 /100 | #313 | Tragic 81.9% |
| Alaskan Athabascans | 0.0 /100 | #314 | Tragic 81.7% |
| Cherokee | 0.0 /100 | #315 | Tragic 81.6% |
| Immigrants | Azores | 0.0 /100 | #316 | Tragic 81.5% |
| Arapaho | 0.0 /100 | #317 | Tragic 81.5% |
| Choctaw | 0.0 /100 | #318 | Tragic 81.4% |
| Shoshone | 0.0 /100 | #319 | Tragic 81.4% |
Demographics Similar to Swiss by In Labor Force | Age 30-34
In terms of in labor force | age 30-34, the demographic groups most similar to Swiss are Immigrants from Panama (84.3%, a difference of 0.020%), Danish (84.3%, a difference of 0.020%), Immigrants from Germany (84.3%, a difference of 0.040%), European (84.3%, a difference of 0.040%), and Immigrants from Ecuador (84.3%, a difference of 0.040%).
| Demographics | Rating | Rank | In Labor Force | Age 30-34 |
| Immigrants | Western Asia | 8.2 /100 | #212 | Tragic 84.3% |
| Immigrants | Jamaica | 7.9 /100 | #213 | Tragic 84.3% |
| Immigrants | Germany | 7.2 /100 | #214 | Tragic 84.3% |
| Europeans | 7.2 /100 | #215 | Tragic 84.3% |
| Immigrants | Ecuador | 7.1 /100 | #216 | Tragic 84.3% |
| Immigrants | Trinidad and Tobago | 7.0 /100 | #217 | Tragic 84.3% |
| Immigrants | Panama | 6.3 /100 | #218 | Tragic 84.3% |
| Swiss | 5.8 /100 | #219 | Tragic 84.3% |
| Danes | 5.3 /100 | #220 | Tragic 84.3% |
| Salvadorans | 3.8 /100 | #221 | Tragic 84.2% |
| Panamanians | 3.8 /100 | #222 | Tragic 84.2% |
| Immigrants | Laos | 3.6 /100 | #223 | Tragic 84.2% |
| Cubans | 3.4 /100 | #224 | Tragic 84.2% |
| Scottish | 3.1 /100 | #225 | Tragic 84.2% |
| Immigrants | El Salvador | 3.0 /100 | #226 | Tragic 84.2% |