Mexican vs Cypriot In Labor Force | Age 30-34
COMPARE
Mexican
Cypriot
In Labor Force | Age 30-34
In Labor Force | Age 30-34 Comparison
Mexicans
Cypriots
81.9%
IN LABOR FORCE | AGE 30-34
0.0/ 100
METRIC RATING
312th/ 347
METRIC RANK
85.8%
IN LABOR FORCE | AGE 30-34
99.9/ 100
METRIC RATING
32nd/ 347
METRIC RANK
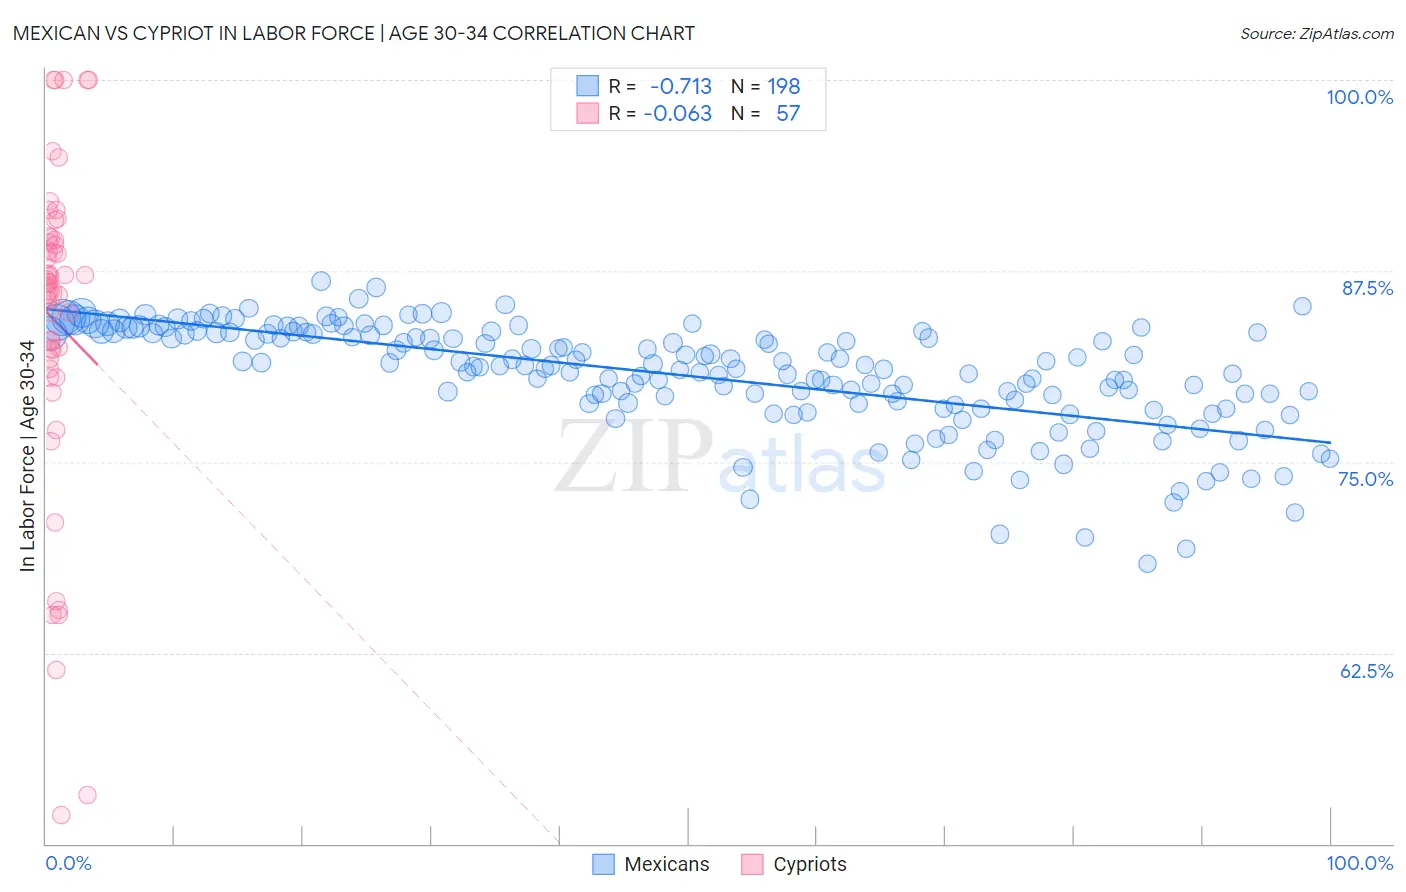
Mexican vs Cypriot In Labor Force | Age 30-34 Correlation Chart
The statistical analysis conducted on geographies consisting of 564,037,152 people shows a strong negative correlation between the proportion of Mexicans and labor force participation rate among population between the ages 30 and 34 in the United States with a correlation coefficient (R) of -0.713 and weighted average of 81.9%. Similarly, the statistical analysis conducted on geographies consisting of 61,842,165 people shows a slight negative correlation between the proportion of Cypriots and labor force participation rate among population between the ages 30 and 34 in the United States with a correlation coefficient (R) of -0.063 and weighted average of 85.8%, a difference of 4.7%.
In Labor Force | Age 30-34 Correlation Summary
| Measurement | Mexican | Cypriot |
| Minimum | 68.3% | 51.9% |
| Maximum | 86.8% | 100.0% |
| Range | 18.5% | 48.1% |
| Mean | 80.7% | 84.2% |
| Median | 81.3% | 86.7% |
| Interquartile 25% (IQ1) | 78.8% | 81.4% |
| Interquartile 75% (IQ3) | 83.5% | 89.6% |
| Interquartile Range (IQR) | 4.6% | 8.1% |
| Standard Deviation (Sample) | 3.5% | 10.7% |
| Standard Deviation (Population) | 3.5% | 10.6% |
Similar Demographics by In Labor Force | Age 30-34
Demographics Similar to Mexicans by In Labor Force | Age 30-34
In terms of in labor force | age 30-34, the demographic groups most similar to Mexicans are Chickasaw (81.9%, a difference of 0.0%), Iroquois (81.9%, a difference of 0.020%), Cajun (82.0%, a difference of 0.050%), Immigrants from Mexico (82.0%, a difference of 0.070%), and Puget Sound Salish (82.1%, a difference of 0.24%).
| Demographics | Rating | Rank | In Labor Force | Age 30-34 |
| Osage | 0.0 /100 | #305 | Tragic 82.3% |
| Spanish American Indians | 0.0 /100 | #306 | Tragic 82.2% |
| Menominee | 0.0 /100 | #307 | Tragic 82.2% |
| Puget Sound Salish | 0.0 /100 | #308 | Tragic 82.1% |
| Immigrants | Mexico | 0.0 /100 | #309 | Tragic 82.0% |
| Cajuns | 0.0 /100 | #310 | Tragic 82.0% |
| Chickasaw | 0.0 /100 | #311 | Tragic 81.9% |
| Mexicans | 0.0 /100 | #312 | Tragic 81.9% |
| Iroquois | 0.0 /100 | #313 | Tragic 81.9% |
| Alaskan Athabascans | 0.0 /100 | #314 | Tragic 81.7% |
| Cherokee | 0.0 /100 | #315 | Tragic 81.6% |
| Immigrants | Azores | 0.0 /100 | #316 | Tragic 81.5% |
| Arapaho | 0.0 /100 | #317 | Tragic 81.5% |
| Choctaw | 0.0 /100 | #318 | Tragic 81.4% |
| Shoshone | 0.0 /100 | #319 | Tragic 81.4% |
Demographics Similar to Cypriots by In Labor Force | Age 30-34
In terms of in labor force | age 30-34, the demographic groups most similar to Cypriots are Paraguayan (85.8%, a difference of 0.0%), Immigrants from Hong Kong (85.8%, a difference of 0.020%), Immigrants from Bosnia and Herzegovina (85.8%, a difference of 0.040%), Ugandan (85.8%, a difference of 0.050%), and Serbian (85.8%, a difference of 0.050%).
| Demographics | Rating | Rank | In Labor Force | Age 30-34 |
| Immigrants | North Macedonia | 100.0 /100 | #25 | Exceptional 85.9% |
| Immigrants | Eastern Africa | 100.0 /100 | #26 | Exceptional 85.9% |
| Immigrants | Liberia | 100.0 /100 | #27 | Exceptional 85.9% |
| Immigrants | Latvia | 100.0 /100 | #28 | Exceptional 85.9% |
| Tsimshian | 100.0 /100 | #29 | Exceptional 85.8% |
| Immigrants | Hong Kong | 100.0 /100 | #30 | Exceptional 85.8% |
| Paraguayans | 99.9 /100 | #31 | Exceptional 85.8% |
| Cypriots | 99.9 /100 | #32 | Exceptional 85.8% |
| Immigrants | Bosnia and Herzegovina | 99.9 /100 | #33 | Exceptional 85.8% |
| Ugandans | 99.9 /100 | #34 | Exceptional 85.8% |
| Serbians | 99.9 /100 | #35 | Exceptional 85.8% |
| Albanians | 99.9 /100 | #36 | Exceptional 85.7% |
| Norwegians | 99.9 /100 | #37 | Exceptional 85.7% |
| Immigrants | Greece | 99.9 /100 | #38 | Exceptional 85.7% |
| Eastern Europeans | 99.9 /100 | #39 | Exceptional 85.7% |