South American vs Swiss In Labor Force | Age 30-34
COMPARE
South American
Swiss
In Labor Force | Age 30-34
In Labor Force | Age 30-34 Comparison
South Americans
Swiss
84.7%
IN LABOR FORCE | AGE 30-34
58.7/ 100
METRIC RATING
162nd/ 347
METRIC RANK
84.3%
IN LABOR FORCE | AGE 30-34
5.8/ 100
METRIC RATING
219th/ 347
METRIC RANK
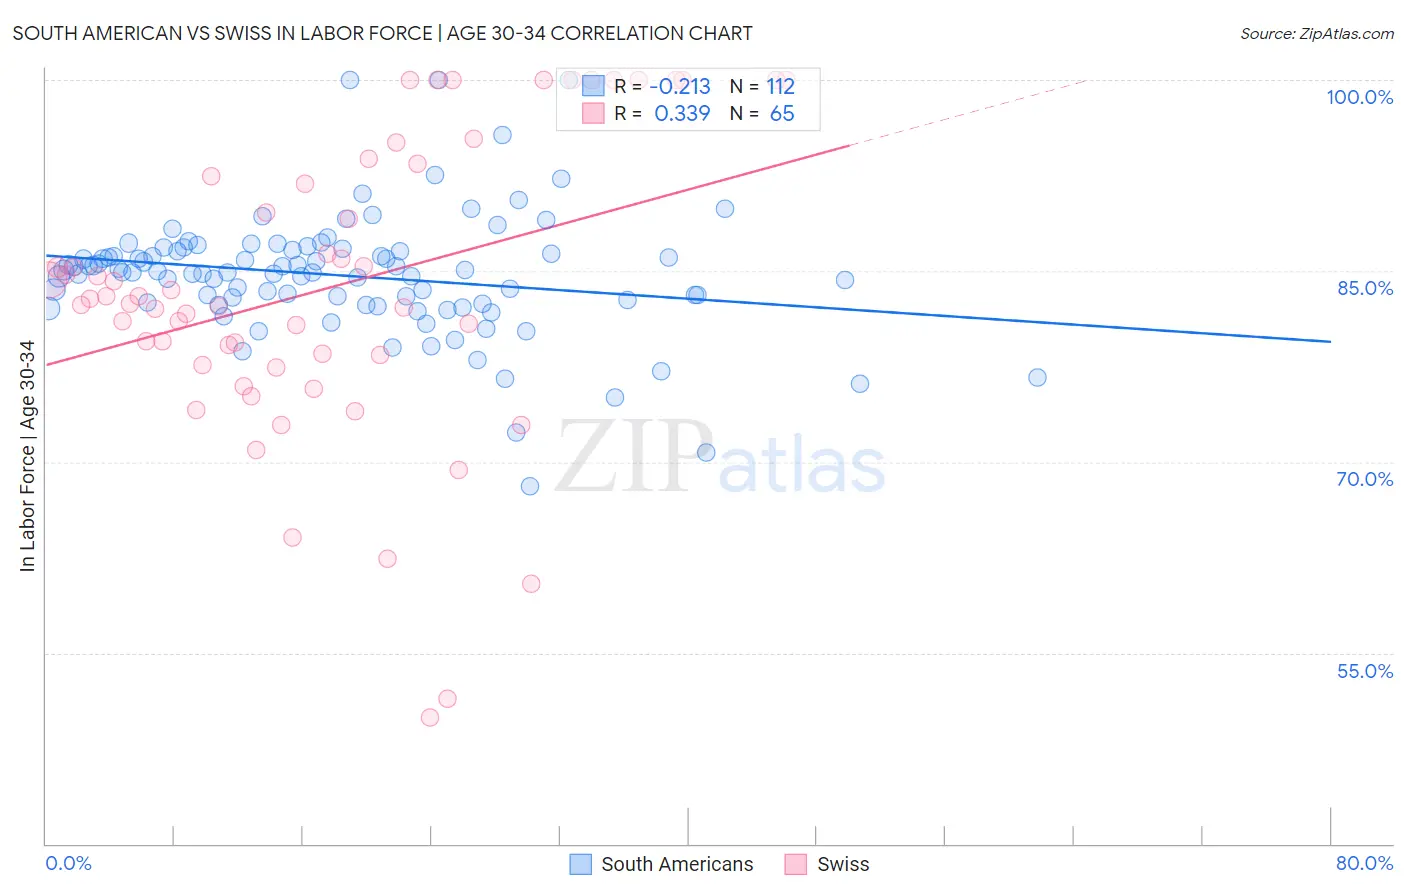
South American vs Swiss In Labor Force | Age 30-34 Correlation Chart
The statistical analysis conducted on geographies consisting of 493,657,533 people shows a weak negative correlation between the proportion of South Americans and labor force participation rate among population between the ages 30 and 34 in the United States with a correlation coefficient (R) of -0.213 and weighted average of 84.7%. Similarly, the statistical analysis conducted on geographies consisting of 464,594,297 people shows a mild positive correlation between the proportion of Swiss and labor force participation rate among population between the ages 30 and 34 in the United States with a correlation coefficient (R) of 0.339 and weighted average of 84.3%, a difference of 0.55%.
In Labor Force | Age 30-34 Correlation Summary
| Measurement | South American | Swiss |
| Minimum | 68.1% | 49.9% |
| Maximum | 100.0% | 100.0% |
| Range | 31.9% | 50.1% |
| Mean | 84.6% | 83.6% |
| Median | 84.9% | 82.8% |
| Interquartile 25% (IQ1) | 82.5% | 78.0% |
| Interquartile 75% (IQ3) | 86.6% | 93.0% |
| Interquartile Range (IQR) | 4.1% | 15.0% |
| Standard Deviation (Sample) | 4.9% | 11.7% |
| Standard Deviation (Population) | 4.8% | 11.6% |
Similar Demographics by In Labor Force | Age 30-34
Demographics Similar to South Americans by In Labor Force | Age 30-34
In terms of in labor force | age 30-34, the demographic groups most similar to South Americans are Immigrants from Cambodia (84.7%, a difference of 0.010%), Immigrants from Uruguay (84.7%, a difference of 0.010%), Icelander (84.7%, a difference of 0.010%), Immigrants from Western Europe (84.7%, a difference of 0.010%), and Pakistani (84.7%, a difference of 0.020%).
| Demographics | Rating | Rank | In Labor Force | Age 30-34 |
| Immigrants | Sudan | 69.5 /100 | #155 | Good 84.8% |
| French Canadians | 67.3 /100 | #156 | Good 84.8% |
| Peruvians | 65.9 /100 | #157 | Good 84.8% |
| Immigrants | Armenia | 64.7 /100 | #158 | Good 84.8% |
| Czechoslovakians | 63.0 /100 | #159 | Good 84.8% |
| Pakistanis | 60.8 /100 | #160 | Good 84.7% |
| Immigrants | Cambodia | 60.7 /100 | #161 | Good 84.7% |
| South Americans | 58.7 /100 | #162 | Average 84.7% |
| Immigrants | Uruguay | 57.4 /100 | #163 | Average 84.7% |
| Icelanders | 56.8 /100 | #164 | Average 84.7% |
| Immigrants | Western Europe | 56.7 /100 | #165 | Average 84.7% |
| Afghans | 55.2 /100 | #166 | Average 84.7% |
| Immigrants | South Eastern Asia | 54.2 /100 | #167 | Average 84.7% |
| Immigrants | Peru | 52.4 /100 | #168 | Average 84.7% |
| South American Indians | 52.1 /100 | #169 | Average 84.7% |
Demographics Similar to Swiss by In Labor Force | Age 30-34
In terms of in labor force | age 30-34, the demographic groups most similar to Swiss are Immigrants from Panama (84.3%, a difference of 0.020%), Danish (84.3%, a difference of 0.020%), Immigrants from Germany (84.3%, a difference of 0.040%), European (84.3%, a difference of 0.040%), and Immigrants from Ecuador (84.3%, a difference of 0.040%).
| Demographics | Rating | Rank | In Labor Force | Age 30-34 |
| Immigrants | Western Asia | 8.2 /100 | #212 | Tragic 84.3% |
| Immigrants | Jamaica | 7.9 /100 | #213 | Tragic 84.3% |
| Immigrants | Germany | 7.2 /100 | #214 | Tragic 84.3% |
| Europeans | 7.2 /100 | #215 | Tragic 84.3% |
| Immigrants | Ecuador | 7.1 /100 | #216 | Tragic 84.3% |
| Immigrants | Trinidad and Tobago | 7.0 /100 | #217 | Tragic 84.3% |
| Immigrants | Panama | 6.3 /100 | #218 | Tragic 84.3% |
| Swiss | 5.8 /100 | #219 | Tragic 84.3% |
| Danes | 5.3 /100 | #220 | Tragic 84.3% |
| Salvadorans | 3.8 /100 | #221 | Tragic 84.2% |
| Panamanians | 3.8 /100 | #222 | Tragic 84.2% |
| Immigrants | Laos | 3.6 /100 | #223 | Tragic 84.2% |
| Cubans | 3.4 /100 | #224 | Tragic 84.2% |
| Scottish | 3.1 /100 | #225 | Tragic 84.2% |
| Immigrants | El Salvador | 3.0 /100 | #226 | Tragic 84.2% |