Mexican vs Crow In Labor Force | Age 30-34
COMPARE
Mexican
Crow
In Labor Force | Age 30-34
In Labor Force | Age 30-34 Comparison
Mexicans
Crow
81.9%
IN LABOR FORCE | AGE 30-34
0.0/ 100
METRIC RATING
312th/ 347
METRIC RANK
75.9%
IN LABOR FORCE | AGE 30-34
0.0/ 100
METRIC RATING
346th/ 347
METRIC RANK
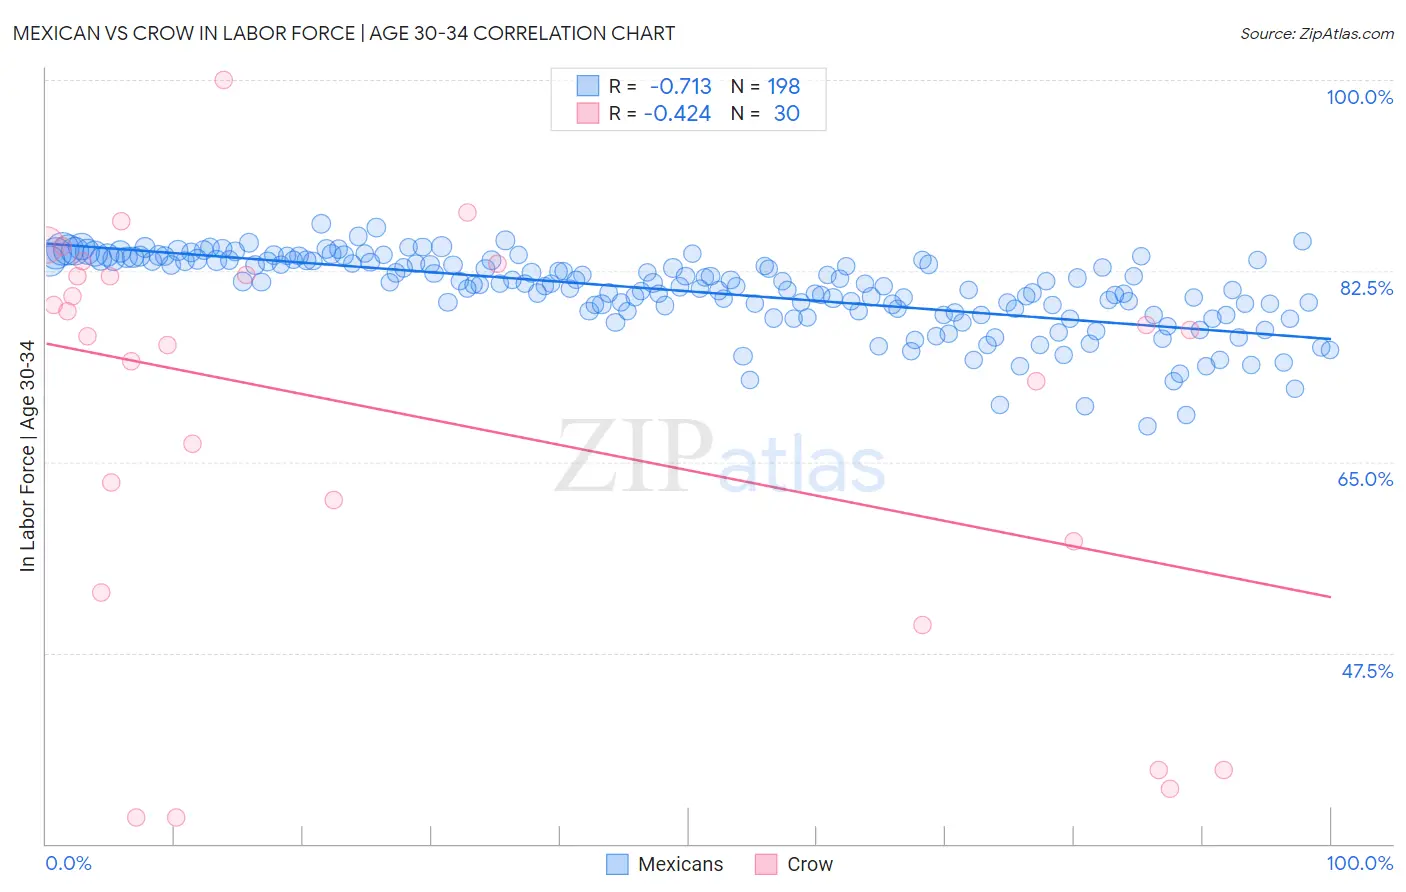
Mexican vs Crow In Labor Force | Age 30-34 Correlation Chart
The statistical analysis conducted on geographies consisting of 564,037,152 people shows a strong negative correlation between the proportion of Mexicans and labor force participation rate among population between the ages 30 and 34 in the United States with a correlation coefficient (R) of -0.713 and weighted average of 81.9%. Similarly, the statistical analysis conducted on geographies consisting of 59,195,148 people shows a moderate negative correlation between the proportion of Crow and labor force participation rate among population between the ages 30 and 34 in the United States with a correlation coefficient (R) of -0.424 and weighted average of 75.9%, a difference of 7.9%.
In Labor Force | Age 30-34 Correlation Summary
| Measurement | Mexican | Crow |
| Minimum | 68.3% | 32.4% |
| Maximum | 86.8% | 100.0% |
| Range | 18.5% | 67.6% |
| Mean | 80.7% | 69.1% |
| Median | 81.3% | 76.8% |
| Interquartile 25% (IQ1) | 78.8% | 57.7% |
| Interquartile 75% (IQ3) | 83.5% | 82.1% |
| Interquartile Range (IQR) | 4.6% | 24.4% |
| Standard Deviation (Sample) | 3.5% | 19.0% |
| Standard Deviation (Population) | 3.5% | 18.6% |
Similar Demographics by In Labor Force | Age 30-34
Demographics Similar to Mexicans by In Labor Force | Age 30-34
In terms of in labor force | age 30-34, the demographic groups most similar to Mexicans are Chickasaw (81.9%, a difference of 0.0%), Iroquois (81.9%, a difference of 0.020%), Cajun (82.0%, a difference of 0.050%), Immigrants from Mexico (82.0%, a difference of 0.070%), and Puget Sound Salish (82.1%, a difference of 0.24%).
| Demographics | Rating | Rank | In Labor Force | Age 30-34 |
| Osage | 0.0 /100 | #305 | Tragic 82.3% |
| Spanish American Indians | 0.0 /100 | #306 | Tragic 82.2% |
| Menominee | 0.0 /100 | #307 | Tragic 82.2% |
| Puget Sound Salish | 0.0 /100 | #308 | Tragic 82.1% |
| Immigrants | Mexico | 0.0 /100 | #309 | Tragic 82.0% |
| Cajuns | 0.0 /100 | #310 | Tragic 82.0% |
| Chickasaw | 0.0 /100 | #311 | Tragic 81.9% |
| Mexicans | 0.0 /100 | #312 | Tragic 81.9% |
| Iroquois | 0.0 /100 | #313 | Tragic 81.9% |
| Alaskan Athabascans | 0.0 /100 | #314 | Tragic 81.7% |
| Cherokee | 0.0 /100 | #315 | Tragic 81.6% |
| Immigrants | Azores | 0.0 /100 | #316 | Tragic 81.5% |
| Arapaho | 0.0 /100 | #317 | Tragic 81.5% |
| Choctaw | 0.0 /100 | #318 | Tragic 81.4% |
| Shoshone | 0.0 /100 | #319 | Tragic 81.4% |
Demographics Similar to Crow by In Labor Force | Age 30-34
In terms of in labor force | age 30-34, the demographic groups most similar to Crow are Yup'ik (76.4%, a difference of 0.68%), Yuman (77.1%, a difference of 1.5%), Lumbee (77.3%, a difference of 1.8%), Tohono O'odham (77.7%, a difference of 2.4%), and Navajo (73.8%, a difference of 2.9%).
| Demographics | Rating | Rank | In Labor Force | Age 30-34 |
| Inupiat | 0.0 /100 | #333 | Tragic 79.7% |
| Hopi | 0.0 /100 | #334 | Tragic 79.3% |
| Marshallese | 0.0 /100 | #335 | Tragic 79.2% |
| Natives/Alaskans | 0.0 /100 | #336 | Tragic 79.2% |
| Yakama | 0.0 /100 | #337 | Tragic 79.1% |
| Pima | 0.0 /100 | #338 | Tragic 79.0% |
| Apache | 0.0 /100 | #339 | Tragic 79.0% |
| Ute | 0.0 /100 | #340 | Tragic 78.9% |
| Immigrants | Yemen | 0.0 /100 | #341 | Tragic 78.2% |
| Tohono O'odham | 0.0 /100 | #342 | Tragic 77.7% |
| Lumbee | 0.0 /100 | #343 | Tragic 77.3% |
| Yuman | 0.0 /100 | #344 | Tragic 77.1% |
| Yup'ik | 0.0 /100 | #345 | Tragic 76.4% |
| Crow | 0.0 /100 | #346 | Tragic 75.9% |
| Navajo | 0.0 /100 | #347 | Tragic 73.8% |