Senegalese vs Swiss In Labor Force | Age 30-34
COMPARE
Senegalese
Swiss
In Labor Force | Age 30-34
In Labor Force | Age 30-34 Comparison
Senegalese
Swiss
85.4%
IN LABOR FORCE | AGE 30-34
99.4/ 100
METRIC RATING
65th/ 347
METRIC RANK
84.3%
IN LABOR FORCE | AGE 30-34
5.8/ 100
METRIC RATING
219th/ 347
METRIC RANK
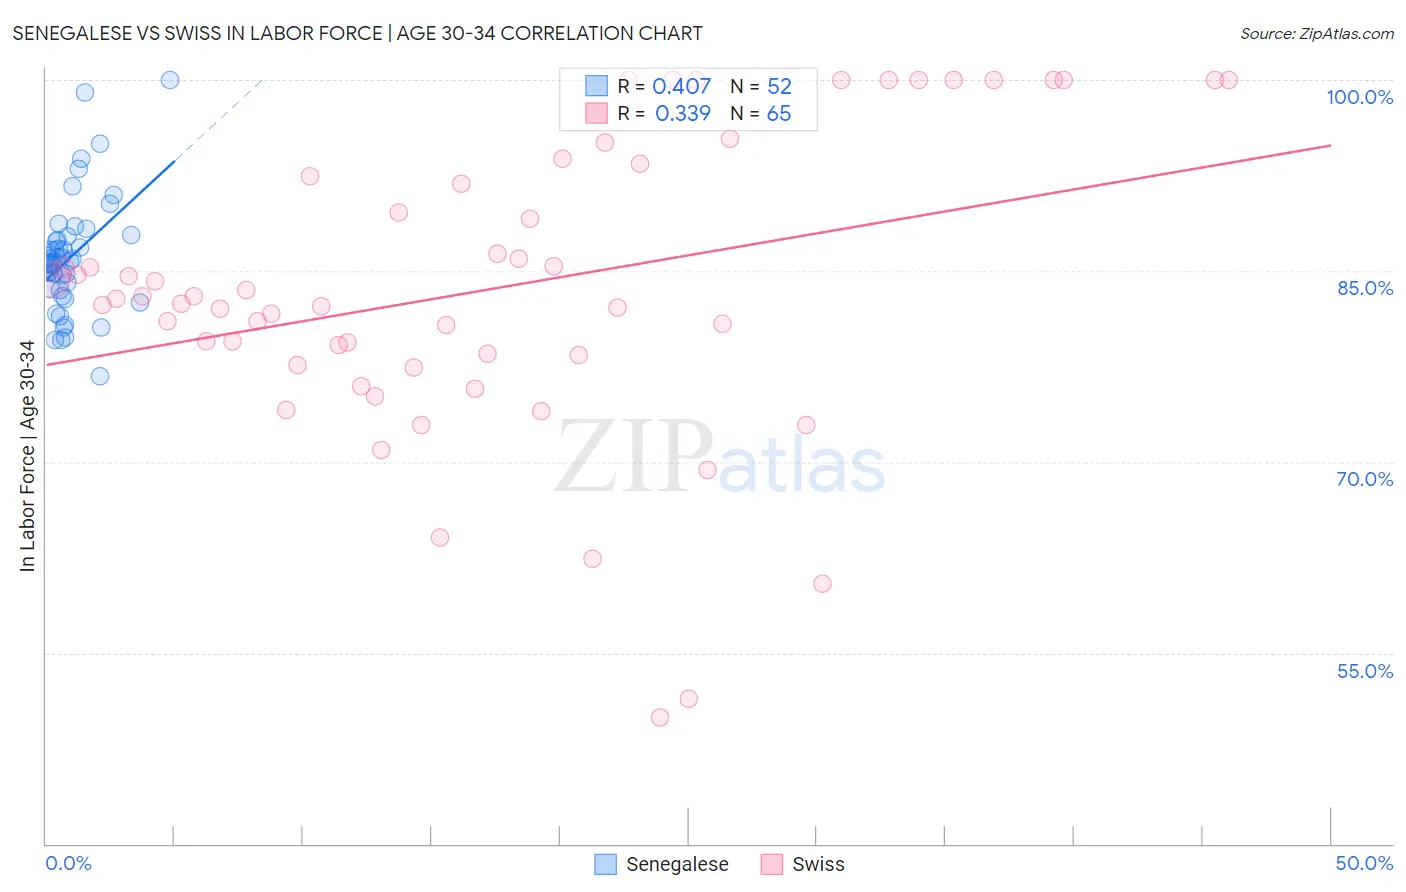
Senegalese vs Swiss In Labor Force | Age 30-34 Correlation Chart
The statistical analysis conducted on geographies consisting of 78,106,128 people shows a moderate positive correlation between the proportion of Senegalese and labor force participation rate among population between the ages 30 and 34 in the United States with a correlation coefficient (R) of 0.407 and weighted average of 85.4%. Similarly, the statistical analysis conducted on geographies consisting of 464,594,297 people shows a mild positive correlation between the proportion of Swiss and labor force participation rate among population between the ages 30 and 34 in the United States with a correlation coefficient (R) of 0.339 and weighted average of 84.3%, a difference of 1.4%.
In Labor Force | Age 30-34 Correlation Summary
| Measurement | Senegalese | Swiss |
| Minimum | 76.7% | 49.9% |
| Maximum | 100.0% | 100.0% |
| Range | 23.3% | 50.1% |
| Mean | 86.1% | 83.6% |
| Median | 85.7% | 82.8% |
| Interquartile 25% (IQ1) | 83.5% | 78.0% |
| Interquartile 75% (IQ3) | 87.6% | 93.0% |
| Interquartile Range (IQR) | 4.1% | 15.0% |
| Standard Deviation (Sample) | 4.5% | 11.7% |
| Standard Deviation (Population) | 4.5% | 11.6% |
Similar Demographics by In Labor Force | Age 30-34
Demographics Similar to Senegalese by In Labor Force | Age 30-34
In terms of in labor force | age 30-34, the demographic groups most similar to Senegalese are Italian (85.4%, a difference of 0.0%), Macedonian (85.5%, a difference of 0.010%), Ghanaian (85.4%, a difference of 0.010%), Kenyan (85.4%, a difference of 0.010%), and Immigrants from Brazil (85.5%, a difference of 0.020%).
| Demographics | Rating | Rank | In Labor Force | Age 30-34 |
| Poles | 99.6 /100 | #58 | Exceptional 85.5% |
| Immigrants | Poland | 99.5 /100 | #59 | Exceptional 85.5% |
| Immigrants | France | 99.5 /100 | #60 | Exceptional 85.5% |
| Immigrants | Brazil | 99.5 /100 | #61 | Exceptional 85.5% |
| Soviet Union | 99.4 /100 | #62 | Exceptional 85.5% |
| Macedonians | 99.4 /100 | #63 | Exceptional 85.5% |
| Italians | 99.4 /100 | #64 | Exceptional 85.4% |
| Senegalese | 99.4 /100 | #65 | Exceptional 85.4% |
| Ghanaians | 99.4 /100 | #66 | Exceptional 85.4% |
| Kenyans | 99.3 /100 | #67 | Exceptional 85.4% |
| Immigrants | Eastern Europe | 99.3 /100 | #68 | Exceptional 85.4% |
| Immigrants | Iran | 99.2 /100 | #69 | Exceptional 85.4% |
| Brazilians | 99.1 /100 | #70 | Exceptional 85.4% |
| Immigrants | Japan | 99.1 /100 | #71 | Exceptional 85.4% |
| Immigrants | China | 99.0 /100 | #72 | Exceptional 85.4% |
Demographics Similar to Swiss by In Labor Force | Age 30-34
In terms of in labor force | age 30-34, the demographic groups most similar to Swiss are Immigrants from Panama (84.3%, a difference of 0.020%), Danish (84.3%, a difference of 0.020%), Immigrants from Germany (84.3%, a difference of 0.040%), European (84.3%, a difference of 0.040%), and Immigrants from Ecuador (84.3%, a difference of 0.040%).
| Demographics | Rating | Rank | In Labor Force | Age 30-34 |
| Immigrants | Western Asia | 8.2 /100 | #212 | Tragic 84.3% |
| Immigrants | Jamaica | 7.9 /100 | #213 | Tragic 84.3% |
| Immigrants | Germany | 7.2 /100 | #214 | Tragic 84.3% |
| Europeans | 7.2 /100 | #215 | Tragic 84.3% |
| Immigrants | Ecuador | 7.1 /100 | #216 | Tragic 84.3% |
| Immigrants | Trinidad and Tobago | 7.0 /100 | #217 | Tragic 84.3% |
| Immigrants | Panama | 6.3 /100 | #218 | Tragic 84.3% |
| Swiss | 5.8 /100 | #219 | Tragic 84.3% |
| Danes | 5.3 /100 | #220 | Tragic 84.3% |
| Salvadorans | 3.8 /100 | #221 | Tragic 84.2% |
| Panamanians | 3.8 /100 | #222 | Tragic 84.2% |
| Immigrants | Laos | 3.6 /100 | #223 | Tragic 84.2% |
| Cubans | 3.4 /100 | #224 | Tragic 84.2% |
| Scottish | 3.1 /100 | #225 | Tragic 84.2% |
| Immigrants | El Salvador | 3.0 /100 | #226 | Tragic 84.2% |