Mexican vs Immigrants from Colombia In Labor Force | Age 30-34
COMPARE
Mexican
Immigrants from Colombia
In Labor Force | Age 30-34
In Labor Force | Age 30-34 Comparison
Mexicans
Immigrants from Colombia
81.9%
IN LABOR FORCE | AGE 30-34
0.0/ 100
METRIC RATING
312th/ 347
METRIC RANK
84.9%
IN LABOR FORCE | AGE 30-34
76.3/ 100
METRIC RATING
147th/ 347
METRIC RANK
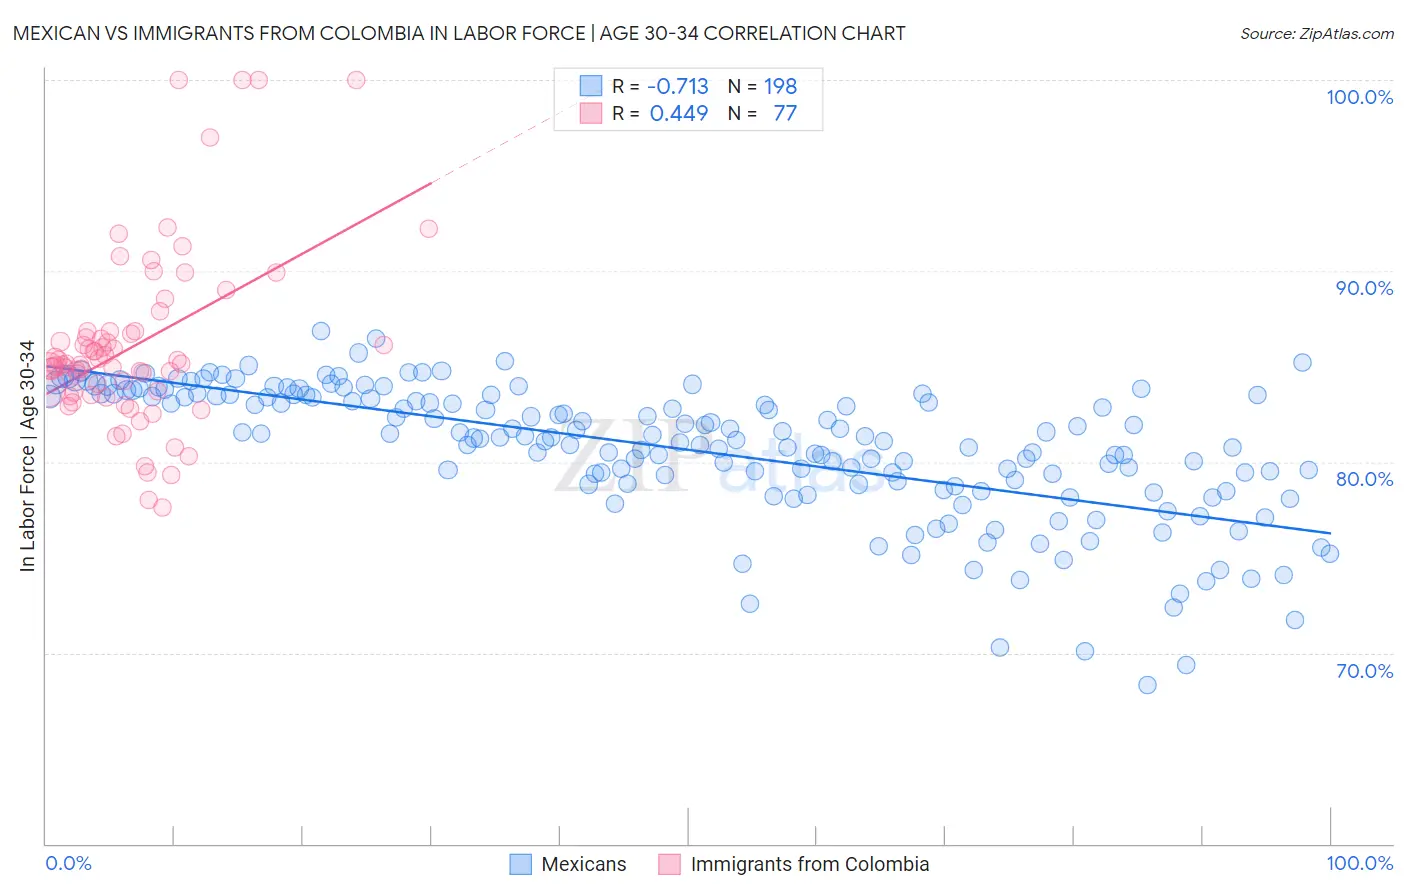
Mexican vs Immigrants from Colombia In Labor Force | Age 30-34 Correlation Chart
The statistical analysis conducted on geographies consisting of 564,037,152 people shows a strong negative correlation between the proportion of Mexicans and labor force participation rate among population between the ages 30 and 34 in the United States with a correlation coefficient (R) of -0.713 and weighted average of 81.9%. Similarly, the statistical analysis conducted on geographies consisting of 378,496,738 people shows a moderate positive correlation between the proportion of Immigrants from Colombia and labor force participation rate among population between the ages 30 and 34 in the United States with a correlation coefficient (R) of 0.449 and weighted average of 84.9%, a difference of 3.6%.
In Labor Force | Age 30-34 Correlation Summary
| Measurement | Mexican | Immigrants from Colombia |
| Minimum | 68.3% | 77.6% |
| Maximum | 86.8% | 100.0% |
| Range | 18.5% | 22.4% |
| Mean | 80.7% | 86.1% |
| Median | 81.3% | 85.1% |
| Interquartile 25% (IQ1) | 78.8% | 83.6% |
| Interquartile 75% (IQ3) | 83.5% | 86.8% |
| Interquartile Range (IQR) | 4.6% | 3.2% |
| Standard Deviation (Sample) | 3.5% | 4.7% |
| Standard Deviation (Population) | 3.5% | 4.6% |
Similar Demographics by In Labor Force | Age 30-34
Demographics Similar to Mexicans by In Labor Force | Age 30-34
In terms of in labor force | age 30-34, the demographic groups most similar to Mexicans are Chickasaw (81.9%, a difference of 0.0%), Iroquois (81.9%, a difference of 0.020%), Cajun (82.0%, a difference of 0.050%), Immigrants from Mexico (82.0%, a difference of 0.070%), and Puget Sound Salish (82.1%, a difference of 0.24%).
| Demographics | Rating | Rank | In Labor Force | Age 30-34 |
| Osage | 0.0 /100 | #305 | Tragic 82.3% |
| Spanish American Indians | 0.0 /100 | #306 | Tragic 82.2% |
| Menominee | 0.0 /100 | #307 | Tragic 82.2% |
| Puget Sound Salish | 0.0 /100 | #308 | Tragic 82.1% |
| Immigrants | Mexico | 0.0 /100 | #309 | Tragic 82.0% |
| Cajuns | 0.0 /100 | #310 | Tragic 82.0% |
| Chickasaw | 0.0 /100 | #311 | Tragic 81.9% |
| Mexicans | 0.0 /100 | #312 | Tragic 81.9% |
| Iroquois | 0.0 /100 | #313 | Tragic 81.9% |
| Alaskan Athabascans | 0.0 /100 | #314 | Tragic 81.7% |
| Cherokee | 0.0 /100 | #315 | Tragic 81.6% |
| Immigrants | Azores | 0.0 /100 | #316 | Tragic 81.5% |
| Arapaho | 0.0 /100 | #317 | Tragic 81.5% |
| Choctaw | 0.0 /100 | #318 | Tragic 81.4% |
| Shoshone | 0.0 /100 | #319 | Tragic 81.4% |
Demographics Similar to Immigrants from Colombia by In Labor Force | Age 30-34
In terms of in labor force | age 30-34, the demographic groups most similar to Immigrants from Colombia are Immigrants from Saudi Arabia (84.9%, a difference of 0.0%), Immigrants from Pakistan (84.9%, a difference of 0.0%), Palestinian (84.9%, a difference of 0.010%), Immigrants from Ukraine (84.8%, a difference of 0.010%), and German (84.8%, a difference of 0.010%).
| Demographics | Rating | Rank | In Labor Force | Age 30-34 |
| Immigrants | Vietnam | 86.5 /100 | #140 | Excellent 85.0% |
| Chileans | 85.3 /100 | #141 | Excellent 84.9% |
| Immigrants | Indonesia | 84.3 /100 | #142 | Excellent 84.9% |
| Colombians | 82.2 /100 | #143 | Excellent 84.9% |
| Uruguayans | 78.5 /100 | #144 | Good 84.9% |
| Palestinians | 77.7 /100 | #145 | Good 84.9% |
| Immigrants | Saudi Arabia | 76.6 /100 | #146 | Good 84.9% |
| Immigrants | Colombia | 76.3 /100 | #147 | Good 84.9% |
| Immigrants | Pakistan | 76.2 /100 | #148 | Good 84.9% |
| Immigrants | Ukraine | 75.1 /100 | #149 | Good 84.8% |
| Germans | 75.1 /100 | #150 | Good 84.8% |
| Immigrants | Senegal | 74.0 /100 | #151 | Good 84.8% |
| Romanians | 73.5 /100 | #152 | Good 84.8% |
| Syrians | 70.1 /100 | #153 | Good 84.8% |
| Northern Europeans | 70.0 /100 | #154 | Good 84.8% |