Immigrants from Portugal vs Swiss In Labor Force | Age 30-34
COMPARE
Immigrants from Portugal
Swiss
In Labor Force | Age 30-34
In Labor Force | Age 30-34 Comparison
Immigrants from Portugal
Swiss
84.0%
IN LABOR FORCE | AGE 30-34
1.2/ 100
METRIC RATING
241st/ 347
METRIC RANK
84.3%
IN LABOR FORCE | AGE 30-34
5.8/ 100
METRIC RATING
219th/ 347
METRIC RANK
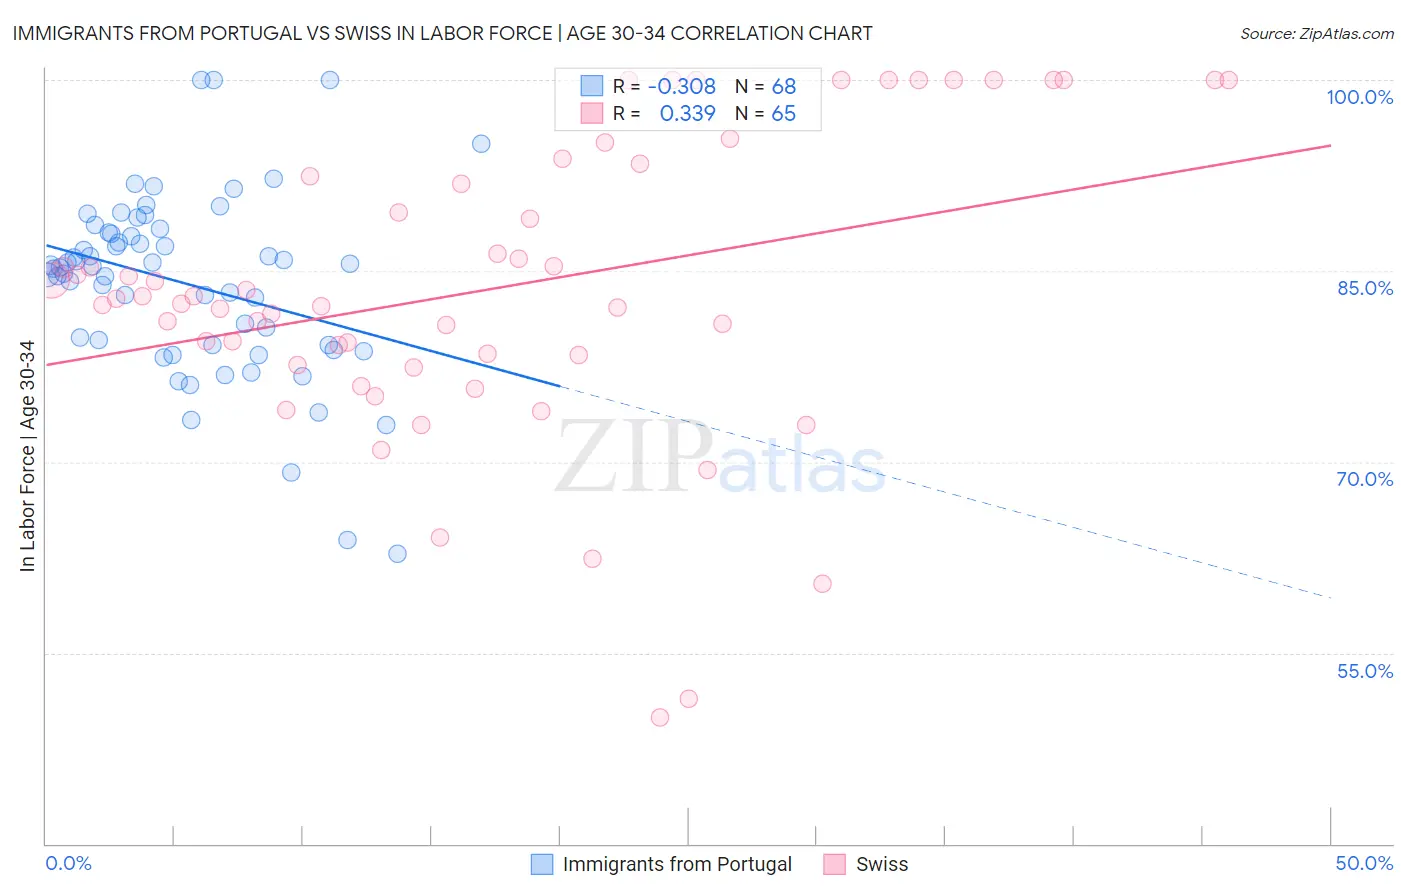
Immigrants from Portugal vs Swiss In Labor Force | Age 30-34 Correlation Chart
The statistical analysis conducted on geographies consisting of 174,756,515 people shows a mild negative correlation between the proportion of Immigrants from Portugal and labor force participation rate among population between the ages 30 and 34 in the United States with a correlation coefficient (R) of -0.308 and weighted average of 84.0%. Similarly, the statistical analysis conducted on geographies consisting of 464,594,297 people shows a mild positive correlation between the proportion of Swiss and labor force participation rate among population between the ages 30 and 34 in the United States with a correlation coefficient (R) of 0.339 and weighted average of 84.3%, a difference of 0.29%.
In Labor Force | Age 30-34 Correlation Summary
| Measurement | Immigrants from Portugal | Swiss |
| Minimum | 62.8% | 49.9% |
| Maximum | 100.0% | 100.0% |
| Range | 37.2% | 50.1% |
| Mean | 84.0% | 83.6% |
| Median | 85.3% | 82.8% |
| Interquartile 25% (IQ1) | 79.2% | 78.0% |
| Interquartile 75% (IQ3) | 88.0% | 93.0% |
| Interquartile Range (IQR) | 8.8% | 15.0% |
| Standard Deviation (Sample) | 7.2% | 11.7% |
| Standard Deviation (Population) | 7.1% | 11.6% |
Similar Demographics by In Labor Force | Age 30-34
Demographics Similar to Immigrants from Portugal by In Labor Force | Age 30-34
In terms of in labor force | age 30-34, the demographic groups most similar to Immigrants from Portugal are Immigrants from Oceania (84.0%, a difference of 0.010%), English (84.0%, a difference of 0.020%), Venezuelan (84.0%, a difference of 0.020%), Immigrants from Caribbean (84.0%, a difference of 0.020%), and Celtic (84.1%, a difference of 0.030%).
| Demographics | Rating | Rank | In Labor Force | Age 30-34 |
| Haitians | 1.8 /100 | #234 | Tragic 84.1% |
| French American Indians | 1.7 /100 | #235 | Tragic 84.1% |
| U.S. Virgin Islanders | 1.5 /100 | #236 | Tragic 84.1% |
| Celtics | 1.4 /100 | #237 | Tragic 84.1% |
| Immigrants | Barbados | 1.4 /100 | #238 | Tragic 84.0% |
| English | 1.4 /100 | #239 | Tragic 84.0% |
| Venezuelans | 1.3 /100 | #240 | Tragic 84.0% |
| Immigrants | Portugal | 1.2 /100 | #241 | Tragic 84.0% |
| Immigrants | Oceania | 1.1 /100 | #242 | Tragic 84.0% |
| Immigrants | Caribbean | 1.1 /100 | #243 | Tragic 84.0% |
| Basques | 0.9 /100 | #244 | Tragic 84.0% |
| Immigrants | Venezuela | 0.9 /100 | #245 | Tragic 84.0% |
| Central Americans | 0.9 /100 | #246 | Tragic 84.0% |
| British West Indians | 0.8 /100 | #247 | Tragic 84.0% |
| Portuguese | 0.8 /100 | #248 | Tragic 84.0% |
Demographics Similar to Swiss by In Labor Force | Age 30-34
In terms of in labor force | age 30-34, the demographic groups most similar to Swiss are Immigrants from Panama (84.3%, a difference of 0.020%), Danish (84.3%, a difference of 0.020%), Immigrants from Germany (84.3%, a difference of 0.040%), European (84.3%, a difference of 0.040%), and Immigrants from Ecuador (84.3%, a difference of 0.040%).
| Demographics | Rating | Rank | In Labor Force | Age 30-34 |
| Immigrants | Western Asia | 8.2 /100 | #212 | Tragic 84.3% |
| Immigrants | Jamaica | 7.9 /100 | #213 | Tragic 84.3% |
| Immigrants | Germany | 7.2 /100 | #214 | Tragic 84.3% |
| Europeans | 7.2 /100 | #215 | Tragic 84.3% |
| Immigrants | Ecuador | 7.1 /100 | #216 | Tragic 84.3% |
| Immigrants | Trinidad and Tobago | 7.0 /100 | #217 | Tragic 84.3% |
| Immigrants | Panama | 6.3 /100 | #218 | Tragic 84.3% |
| Swiss | 5.8 /100 | #219 | Tragic 84.3% |
| Danes | 5.3 /100 | #220 | Tragic 84.3% |
| Salvadorans | 3.8 /100 | #221 | Tragic 84.2% |
| Panamanians | 3.8 /100 | #222 | Tragic 84.2% |
| Immigrants | Laos | 3.6 /100 | #223 | Tragic 84.2% |
| Cubans | 3.4 /100 | #224 | Tragic 84.2% |
| Scottish | 3.1 /100 | #225 | Tragic 84.2% |
| Immigrants | El Salvador | 3.0 /100 | #226 | Tragic 84.2% |