Immigrants from Laos vs Swiss In Labor Force | Age 30-34
COMPARE
Immigrants from Laos
Swiss
In Labor Force | Age 30-34
In Labor Force | Age 30-34 Comparison
Immigrants from Laos
Swiss
84.2%
IN LABOR FORCE | AGE 30-34
3.6/ 100
METRIC RATING
223rd/ 347
METRIC RANK
84.3%
IN LABOR FORCE | AGE 30-34
5.8/ 100
METRIC RATING
219th/ 347
METRIC RANK
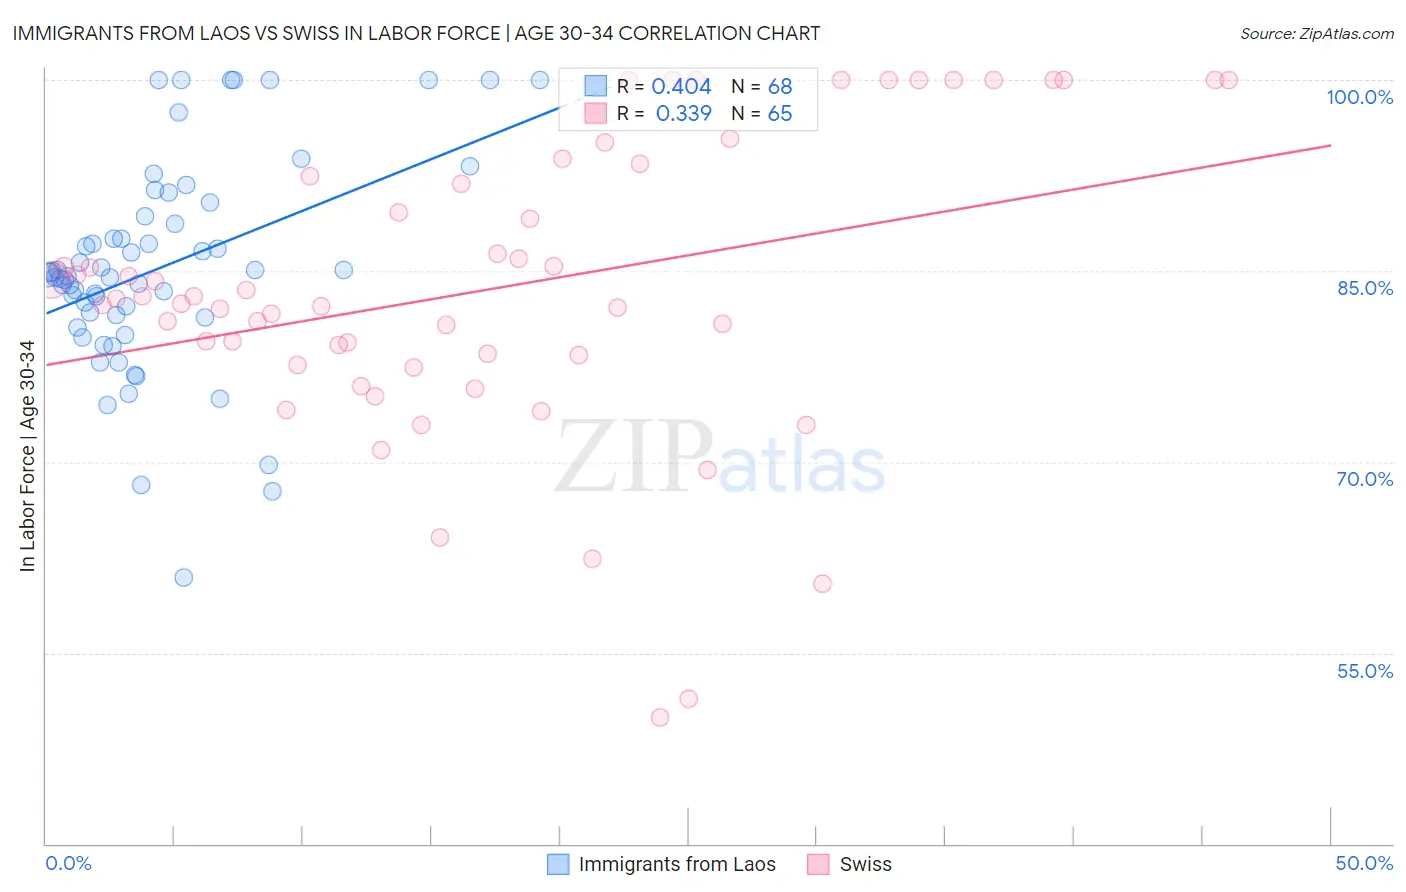
Immigrants from Laos vs Swiss In Labor Force | Age 30-34 Correlation Chart
The statistical analysis conducted on geographies consisting of 201,465,592 people shows a moderate positive correlation between the proportion of Immigrants from Laos and labor force participation rate among population between the ages 30 and 34 in the United States with a correlation coefficient (R) of 0.404 and weighted average of 84.2%. Similarly, the statistical analysis conducted on geographies consisting of 464,594,297 people shows a mild positive correlation between the proportion of Swiss and labor force participation rate among population between the ages 30 and 34 in the United States with a correlation coefficient (R) of 0.339 and weighted average of 84.3%, a difference of 0.090%.
In Labor Force | Age 30-34 Correlation Summary
| Measurement | Immigrants from Laos | Swiss |
| Minimum | 60.9% | 49.9% |
| Maximum | 100.0% | 100.0% |
| Range | 39.1% | 50.1% |
| Mean | 85.2% | 83.6% |
| Median | 84.6% | 82.8% |
| Interquartile 25% (IQ1) | 81.4% | 78.0% |
| Interquartile 75% (IQ3) | 89.0% | 93.0% |
| Interquartile Range (IQR) | 7.6% | 15.0% |
| Standard Deviation (Sample) | 8.2% | 11.7% |
| Standard Deviation (Population) | 8.2% | 11.6% |
Demographics Similar to Immigrants from Laos and Swiss by In Labor Force | Age 30-34
In terms of in labor force | age 30-34, the demographic groups most similar to Immigrants from Laos are Salvadoran (84.2%, a difference of 0.010%), Panamanian (84.2%, a difference of 0.010%), Cuban (84.2%, a difference of 0.010%), Scottish (84.2%, a difference of 0.030%), and Immigrants from El Salvador (84.2%, a difference of 0.030%). Similarly, the demographic groups most similar to Swiss are Immigrants from Panama (84.3%, a difference of 0.020%), Danish (84.3%, a difference of 0.020%), Immigrants from Germany (84.3%, a difference of 0.040%), European (84.3%, a difference of 0.040%), and Immigrants from Ecuador (84.3%, a difference of 0.040%).
| Demographics | Rating | Rank | In Labor Force | Age 30-34 |
| Japanese | 8.8 /100 | #211 | Tragic 84.3% |
| Immigrants | Western Asia | 8.2 /100 | #212 | Tragic 84.3% |
| Immigrants | Jamaica | 7.9 /100 | #213 | Tragic 84.3% |
| Immigrants | Germany | 7.2 /100 | #214 | Tragic 84.3% |
| Europeans | 7.2 /100 | #215 | Tragic 84.3% |
| Immigrants | Ecuador | 7.1 /100 | #216 | Tragic 84.3% |
| Immigrants | Trinidad and Tobago | 7.0 /100 | #217 | Tragic 84.3% |
| Immigrants | Panama | 6.3 /100 | #218 | Tragic 84.3% |
| Swiss | 5.8 /100 | #219 | Tragic 84.3% |
| Danes | 5.3 /100 | #220 | Tragic 84.3% |
| Salvadorans | 3.8 /100 | #221 | Tragic 84.2% |
| Panamanians | 3.8 /100 | #222 | Tragic 84.2% |
| Immigrants | Laos | 3.6 /100 | #223 | Tragic 84.2% |
| Cubans | 3.4 /100 | #224 | Tragic 84.2% |
| Scottish | 3.1 /100 | #225 | Tragic 84.2% |
| Immigrants | El Salvador | 3.0 /100 | #226 | Tragic 84.2% |
| Immigrants | Cuba | 3.0 /100 | #227 | Tragic 84.2% |
| Immigrants | Haiti | 2.8 /100 | #228 | Tragic 84.2% |
| Welsh | 2.7 /100 | #229 | Tragic 84.2% |
| Immigrants | Bahamas | 2.6 /100 | #230 | Tragic 84.1% |
| Malaysians | 2.2 /100 | #231 | Tragic 84.1% |