Mexican vs Swiss Male Disability
COMPARE
Mexican
Swiss
Male Disability
Male Disability Comparison
Mexicans
Swiss
11.8%
MALE DISABILITY
1.7/ 100
METRIC RATING
233rd/ 347
METRIC RANK
12.1%
MALE DISABILITY
0.3/ 100
METRIC RATING
256th/ 347
METRIC RANK
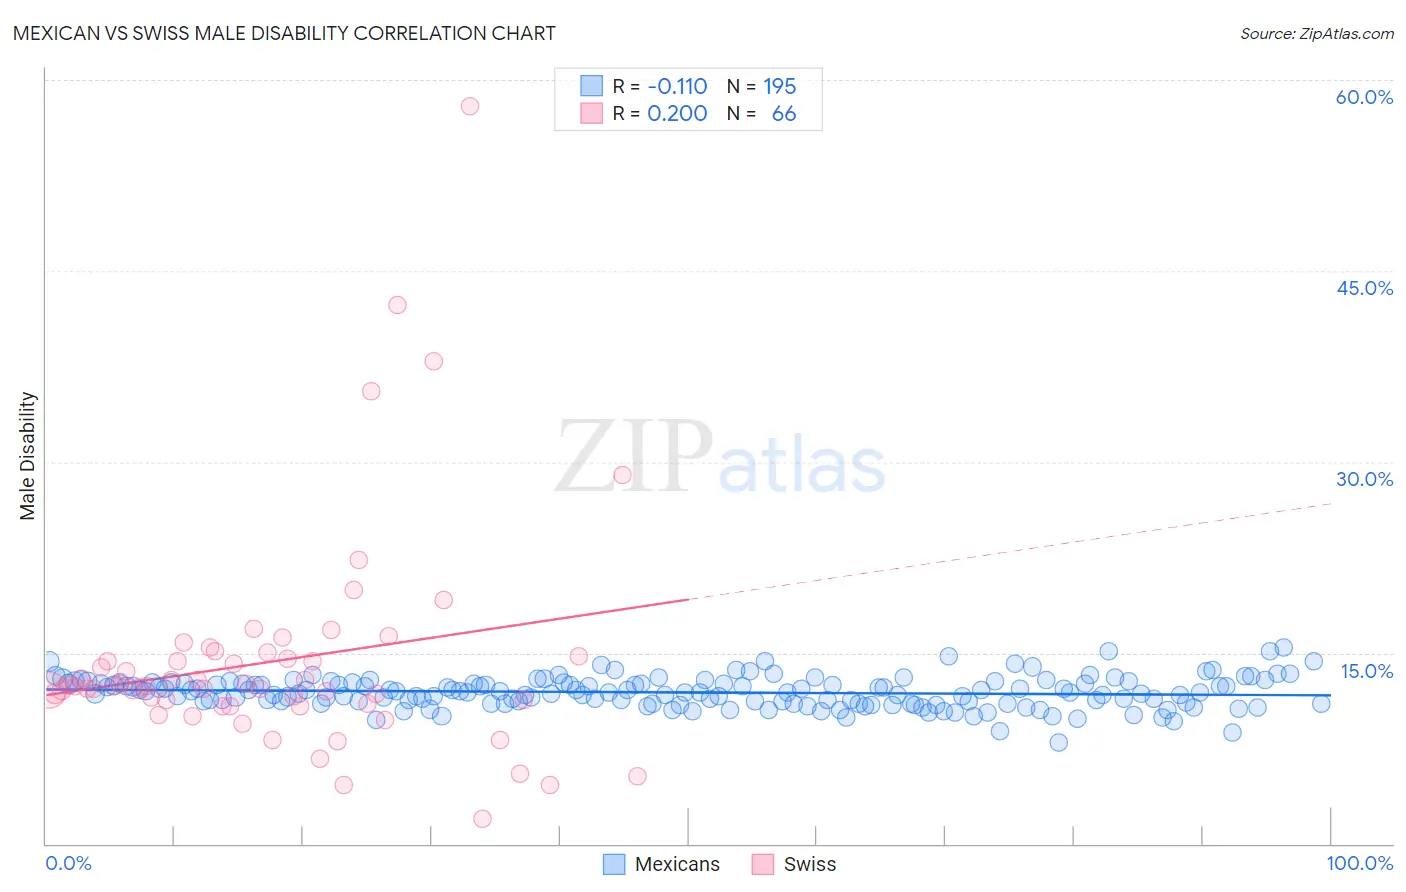
Mexican vs Swiss Male Disability Correlation Chart
The statistical analysis conducted on geographies consisting of 564,830,995 people shows a poor negative correlation between the proportion of Mexicans and percentage of males with a disability in the United States with a correlation coefficient (R) of -0.110 and weighted average of 11.8%. Similarly, the statistical analysis conducted on geographies consisting of 464,975,169 people shows a weak positive correlation between the proportion of Swiss and percentage of males with a disability in the United States with a correlation coefficient (R) of 0.200 and weighted average of 12.1%, a difference of 2.1%.
Male Disability Correlation Summary
| Measurement | Mexican | Swiss |
| Minimum | 8.0% | 2.0% |
| Maximum | 15.4% | 57.9% |
| Range | 7.4% | 55.9% |
| Mean | 11.9% | 14.3% |
| Median | 11.9% | 12.4% |
| Interquartile 25% (IQ1) | 11.1% | 11.0% |
| Interquartile 75% (IQ3) | 12.6% | 14.7% |
| Interquartile Range (IQR) | 1.5% | 3.7% |
| Standard Deviation (Sample) | 1.2% | 8.7% |
| Standard Deviation (Population) | 1.2% | 8.7% |
Similar Demographics by Male Disability
Demographics Similar to Mexicans by Male Disability
In terms of male disability, the demographic groups most similar to Mexicans are Malaysian (11.8%, a difference of 0.040%), Immigrants from Canada (11.9%, a difference of 0.070%), Dominican (11.8%, a difference of 0.10%), Immigrants from North America (11.9%, a difference of 0.20%), and Croatian (11.8%, a difference of 0.30%).
| Demographics | Rating | Rank | Male Disability |
| Sub-Saharan Africans | 2.8 /100 | #226 | Tragic 11.8% |
| Austrians | 2.5 /100 | #227 | Tragic 11.8% |
| Hispanics or Latinos | 2.3 /100 | #228 | Tragic 11.8% |
| Bermudans | 2.3 /100 | #229 | Tragic 11.8% |
| Croatians | 2.1 /100 | #230 | Tragic 11.8% |
| Dominicans | 1.8 /100 | #231 | Tragic 11.8% |
| Malaysians | 1.8 /100 | #232 | Tragic 11.8% |
| Mexicans | 1.7 /100 | #233 | Tragic 11.8% |
| Immigrants | Canada | 1.6 /100 | #234 | Tragic 11.9% |
| Immigrants | North America | 1.5 /100 | #235 | Tragic 11.9% |
| U.S. Virgin Islanders | 1.3 /100 | #236 | Tragic 11.9% |
| Carpatho Rusyns | 1.3 /100 | #237 | Tragic 11.9% |
| Yugoslavians | 1.2 /100 | #238 | Tragic 11.9% |
| Italians | 1.2 /100 | #239 | Tragic 11.9% |
| Czechs | 1.1 /100 | #240 | Tragic 11.9% |
Demographics Similar to Swiss by Male Disability
In terms of male disability, the demographic groups most similar to Swiss are European (12.1%, a difference of 0.0%), Basque (12.1%, a difference of 0.19%), Belgian (12.1%, a difference of 0.24%), Chinese (12.1%, a difference of 0.25%), and British (12.1%, a difference of 0.26%).
| Demographics | Rating | Rank | Male Disability |
| Immigrants | Yemen | 0.5 /100 | #249 | Tragic 12.0% |
| Bangladeshis | 0.5 /100 | #250 | Tragic 12.0% |
| German Russians | 0.5 /100 | #251 | Tragic 12.0% |
| Slovenes | 0.5 /100 | #252 | Tragic 12.0% |
| Guamanians/Chamorros | 0.5 /100 | #253 | Tragic 12.0% |
| British | 0.4 /100 | #254 | Tragic 12.1% |
| Chinese | 0.4 /100 | #255 | Tragic 12.1% |
| Swiss | 0.3 /100 | #256 | Tragic 12.1% |
| Europeans | 0.3 /100 | #257 | Tragic 12.1% |
| Basques | 0.3 /100 | #258 | Tragic 12.1% |
| Belgians | 0.3 /100 | #259 | Tragic 12.1% |
| Swedes | 0.3 /100 | #260 | Tragic 12.1% |
| Slavs | 0.2 /100 | #261 | Tragic 12.2% |
| Norwegians | 0.2 /100 | #262 | Tragic 12.2% |
| Canadians | 0.2 /100 | #263 | Tragic 12.2% |