Immigrants from Korea vs Pima In Labor Force | Age 30-34
COMPARE
Immigrants from Korea
Pima
In Labor Force | Age 30-34
In Labor Force | Age 30-34 Comparison
Immigrants from Korea
Pima
85.2%
IN LABOR FORCE | AGE 30-34
97.3/ 100
METRIC RATING
96th/ 347
METRIC RANK
79.0%
IN LABOR FORCE | AGE 30-34
0.0/ 100
METRIC RATING
338th/ 347
METRIC RANK
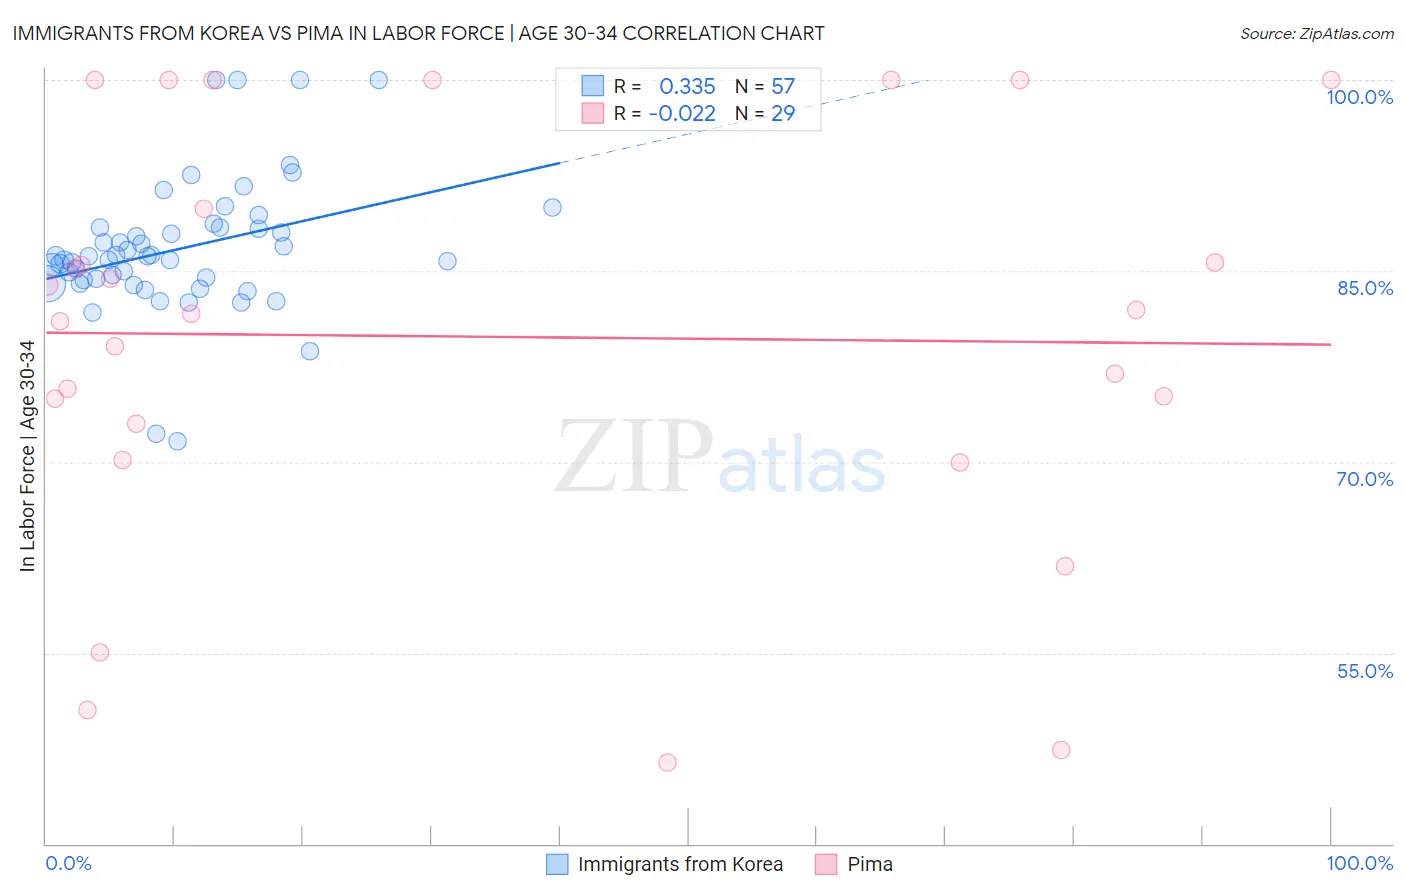
Immigrants from Korea vs Pima In Labor Force | Age 30-34 Correlation Chart
The statistical analysis conducted on geographies consisting of 416,066,569 people shows a mild positive correlation between the proportion of Immigrants from Korea and labor force participation rate among population between the ages 30 and 34 in the United States with a correlation coefficient (R) of 0.335 and weighted average of 85.2%. Similarly, the statistical analysis conducted on geographies consisting of 61,528,436 people shows no correlation between the proportion of Pima and labor force participation rate among population between the ages 30 and 34 in the United States with a correlation coefficient (R) of -0.022 and weighted average of 79.0%, a difference of 7.8%.
In Labor Force | Age 30-34 Correlation Summary
| Measurement | Immigrants from Korea | Pima |
| Minimum | 71.6% | 46.4% |
| Maximum | 100.0% | 100.0% |
| Range | 28.4% | 53.6% |
| Mean | 86.8% | 79.8% |
| Median | 86.2% | 81.6% |
| Interquartile 25% (IQ1) | 84.1% | 71.6% |
| Interquartile 75% (IQ3) | 88.4% | 95.0% |
| Interquartile Range (IQR) | 4.3% | 23.4% |
| Standard Deviation (Sample) | 5.3% | 16.2% |
| Standard Deviation (Population) | 5.3% | 15.9% |
Similar Demographics by In Labor Force | Age 30-34
Demographics Similar to Immigrants from Korea by In Labor Force | Age 30-34
In terms of in labor force | age 30-34, the demographic groups most similar to Immigrants from Korea are Thai (85.2%, a difference of 0.0%), Immigrants from Uganda (85.2%, a difference of 0.0%), Swedish (85.2%, a difference of 0.010%), Immigrants from India (85.2%, a difference of 0.010%), and Belgian (85.2%, a difference of 0.010%).
| Demographics | Rating | Rank | In Labor Force | Age 30-34 |
| Immigrants | Kazakhstan | 98.1 /100 | #89 | Exceptional 85.3% |
| Burmese | 97.9 /100 | #90 | Exceptional 85.3% |
| Immigrants | Moldova | 97.9 /100 | #91 | Exceptional 85.3% |
| German Russians | 97.7 /100 | #92 | Exceptional 85.2% |
| Immigrants | Norway | 97.6 /100 | #93 | Exceptional 85.2% |
| Swedes | 97.5 /100 | #94 | Exceptional 85.2% |
| Immigrants | India | 97.4 /100 | #95 | Exceptional 85.2% |
| Immigrants | Korea | 97.3 /100 | #96 | Exceptional 85.2% |
| Thais | 97.2 /100 | #97 | Exceptional 85.2% |
| Immigrants | Uganda | 97.2 /100 | #98 | Exceptional 85.2% |
| Belgians | 97.2 /100 | #99 | Exceptional 85.2% |
| Sudanese | 97.1 /100 | #100 | Exceptional 85.2% |
| Immigrants | Belarus | 96.9 /100 | #101 | Exceptional 85.2% |
| Immigrants | Austria | 96.8 /100 | #102 | Exceptional 85.2% |
| Ukrainians | 96.6 /100 | #103 | Exceptional 85.2% |
Demographics Similar to Pima by In Labor Force | Age 30-34
In terms of in labor force | age 30-34, the demographic groups most similar to Pima are Apache (79.0%, a difference of 0.030%), Yakama (79.1%, a difference of 0.12%), Ute (78.9%, a difference of 0.13%), Native/Alaskan (79.2%, a difference of 0.16%), and Marshallese (79.2%, a difference of 0.24%).
| Demographics | Rating | Rank | In Labor Force | Age 30-34 |
| Houma | 0.0 /100 | #331 | Tragic 79.9% |
| Kiowa | 0.0 /100 | #332 | Tragic 79.8% |
| Inupiat | 0.0 /100 | #333 | Tragic 79.7% |
| Hopi | 0.0 /100 | #334 | Tragic 79.3% |
| Marshallese | 0.0 /100 | #335 | Tragic 79.2% |
| Natives/Alaskans | 0.0 /100 | #336 | Tragic 79.2% |
| Yakama | 0.0 /100 | #337 | Tragic 79.1% |
| Pima | 0.0 /100 | #338 | Tragic 79.0% |
| Apache | 0.0 /100 | #339 | Tragic 79.0% |
| Ute | 0.0 /100 | #340 | Tragic 78.9% |
| Immigrants | Yemen | 0.0 /100 | #341 | Tragic 78.2% |
| Tohono O'odham | 0.0 /100 | #342 | Tragic 77.7% |
| Lumbee | 0.0 /100 | #343 | Tragic 77.3% |
| Yuman | 0.0 /100 | #344 | Tragic 77.1% |
| Yup'ik | 0.0 /100 | #345 | Tragic 76.4% |