Malaysian vs Immigrants from Yemen In Labor Force | Age 30-34
COMPARE
Malaysian
Immigrants from Yemen
In Labor Force | Age 30-34
In Labor Force | Age 30-34 Comparison
Malaysians
Immigrants from Yemen
84.1%
IN LABOR FORCE | AGE 30-34
2.2/ 100
METRIC RATING
231st/ 347
METRIC RANK
78.2%
IN LABOR FORCE | AGE 30-34
0.0/ 100
METRIC RATING
341st/ 347
METRIC RANK
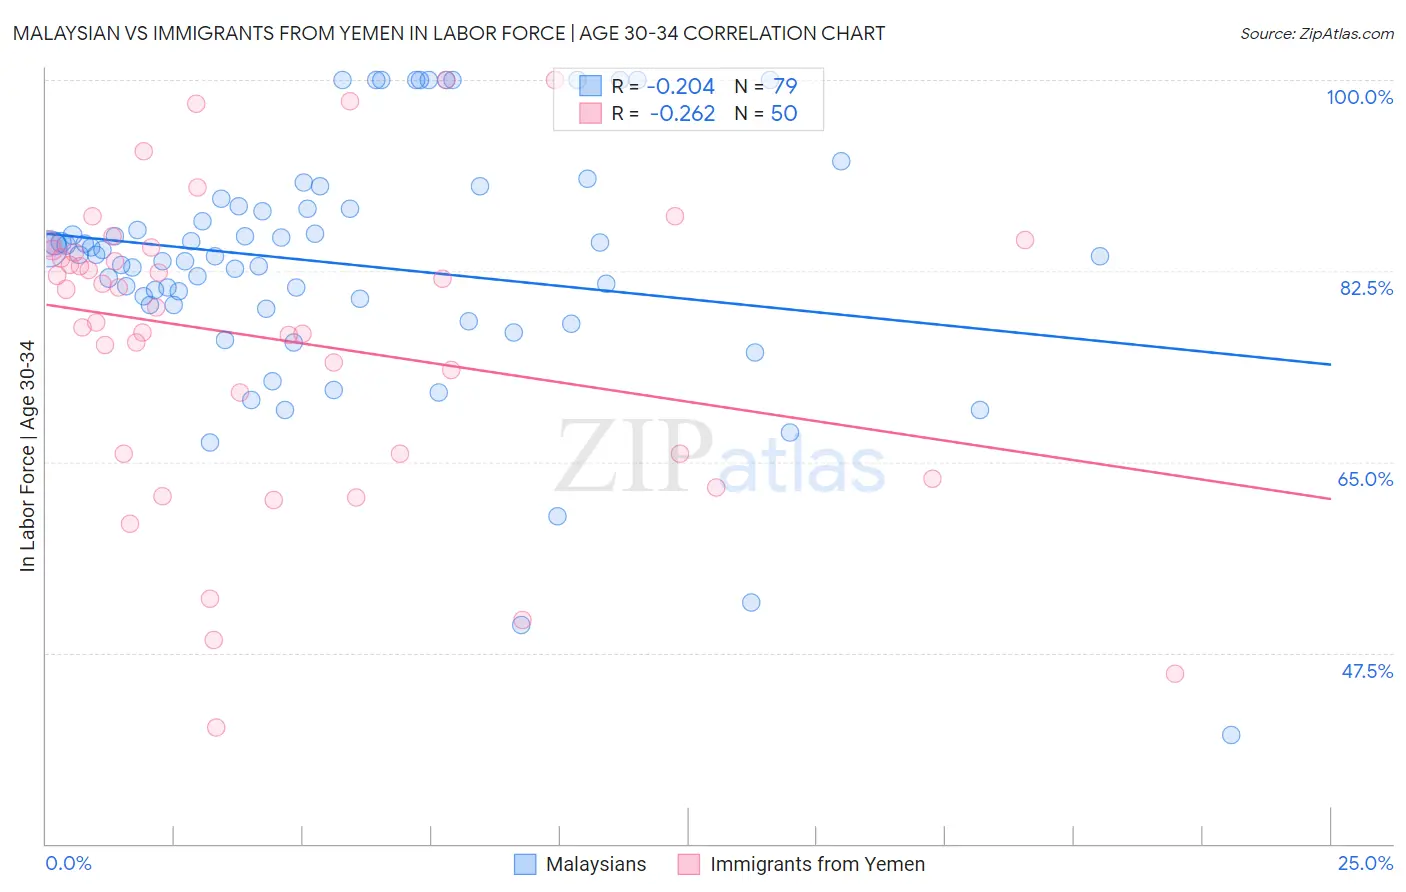
Malaysian vs Immigrants from Yemen In Labor Force | Age 30-34 Correlation Chart
The statistical analysis conducted on geographies consisting of 226,059,295 people shows a weak negative correlation between the proportion of Malaysians and labor force participation rate among population between the ages 30 and 34 in the United States with a correlation coefficient (R) of -0.204 and weighted average of 84.1%. Similarly, the statistical analysis conducted on geographies consisting of 82,432,494 people shows a weak negative correlation between the proportion of Immigrants from Yemen and labor force participation rate among population between the ages 30 and 34 in the United States with a correlation coefficient (R) of -0.262 and weighted average of 78.2%, a difference of 7.6%.
In Labor Force | Age 30-34 Correlation Summary
| Measurement | Malaysian | Immigrants from Yemen |
| Minimum | 40.0% | 40.7% |
| Maximum | 100.0% | 100.0% |
| Range | 60.0% | 59.3% |
| Mean | 83.1% | 76.2% |
| Median | 83.9% | 80.0% |
| Interquartile 25% (IQ1) | 79.4% | 65.7% |
| Interquartile 75% (IQ3) | 88.2% | 84.4% |
| Interquartile Range (IQR) | 8.8% | 18.7% |
| Standard Deviation (Sample) | 11.4% | 13.9% |
| Standard Deviation (Population) | 11.3% | 13.8% |
Similar Demographics by In Labor Force | Age 30-34
Demographics Similar to Malaysians by In Labor Force | Age 30-34
In terms of in labor force | age 30-34, the demographic groups most similar to Malaysians are Immigrants (84.1%, a difference of 0.020%), Immigrants from Bahamas (84.1%, a difference of 0.030%), West Indian (84.1%, a difference of 0.030%), Immigrants from Haiti (84.2%, a difference of 0.040%), and Welsh (84.2%, a difference of 0.040%).
| Demographics | Rating | Rank | In Labor Force | Age 30-34 |
| Cubans | 3.4 /100 | #224 | Tragic 84.2% |
| Scottish | 3.1 /100 | #225 | Tragic 84.2% |
| Immigrants | El Salvador | 3.0 /100 | #226 | Tragic 84.2% |
| Immigrants | Cuba | 3.0 /100 | #227 | Tragic 84.2% |
| Immigrants | Haiti | 2.8 /100 | #228 | Tragic 84.2% |
| Welsh | 2.7 /100 | #229 | Tragic 84.2% |
| Immigrants | Bahamas | 2.6 /100 | #230 | Tragic 84.1% |
| Malaysians | 2.2 /100 | #231 | Tragic 84.1% |
| Immigrants | Immigrants | 2.0 /100 | #232 | Tragic 84.1% |
| West Indians | 1.9 /100 | #233 | Tragic 84.1% |
| Haitians | 1.8 /100 | #234 | Tragic 84.1% |
| French American Indians | 1.7 /100 | #235 | Tragic 84.1% |
| U.S. Virgin Islanders | 1.5 /100 | #236 | Tragic 84.1% |
| Celtics | 1.4 /100 | #237 | Tragic 84.1% |
| Immigrants | Barbados | 1.4 /100 | #238 | Tragic 84.0% |
Demographics Similar to Immigrants from Yemen by In Labor Force | Age 30-34
In terms of in labor force | age 30-34, the demographic groups most similar to Immigrants from Yemen are Tohono O'odham (77.7%, a difference of 0.57%), Ute (78.9%, a difference of 0.98%), Apache (79.0%, a difference of 1.1%), Pima (79.0%, a difference of 1.1%), and Lumbee (77.3%, a difference of 1.2%).
| Demographics | Rating | Rank | In Labor Force | Age 30-34 |
| Inupiat | 0.0 /100 | #333 | Tragic 79.7% |
| Hopi | 0.0 /100 | #334 | Tragic 79.3% |
| Marshallese | 0.0 /100 | #335 | Tragic 79.2% |
| Natives/Alaskans | 0.0 /100 | #336 | Tragic 79.2% |
| Yakama | 0.0 /100 | #337 | Tragic 79.1% |
| Pima | 0.0 /100 | #338 | Tragic 79.0% |
| Apache | 0.0 /100 | #339 | Tragic 79.0% |
| Ute | 0.0 /100 | #340 | Tragic 78.9% |
| Immigrants | Yemen | 0.0 /100 | #341 | Tragic 78.2% |
| Tohono O'odham | 0.0 /100 | #342 | Tragic 77.7% |
| Lumbee | 0.0 /100 | #343 | Tragic 77.3% |
| Yuman | 0.0 /100 | #344 | Tragic 77.1% |
| Yup'ik | 0.0 /100 | #345 | Tragic 76.4% |
| Crow | 0.0 /100 | #346 | Tragic 75.9% |
| Navajo | 0.0 /100 | #347 | Tragic 73.8% |