Malaysian vs Spanish In Labor Force | Age 30-34
COMPARE
Malaysian
Spanish
In Labor Force | Age 30-34
In Labor Force | Age 30-34 Comparison
Malaysians
Spanish
84.1%
IN LABOR FORCE | AGE 30-34
2.2/ 100
METRIC RATING
231st/ 347
METRIC RANK
83.5%
IN LABOR FORCE | AGE 30-34
0.0/ 100
METRIC RATING
271st/ 347
METRIC RANK
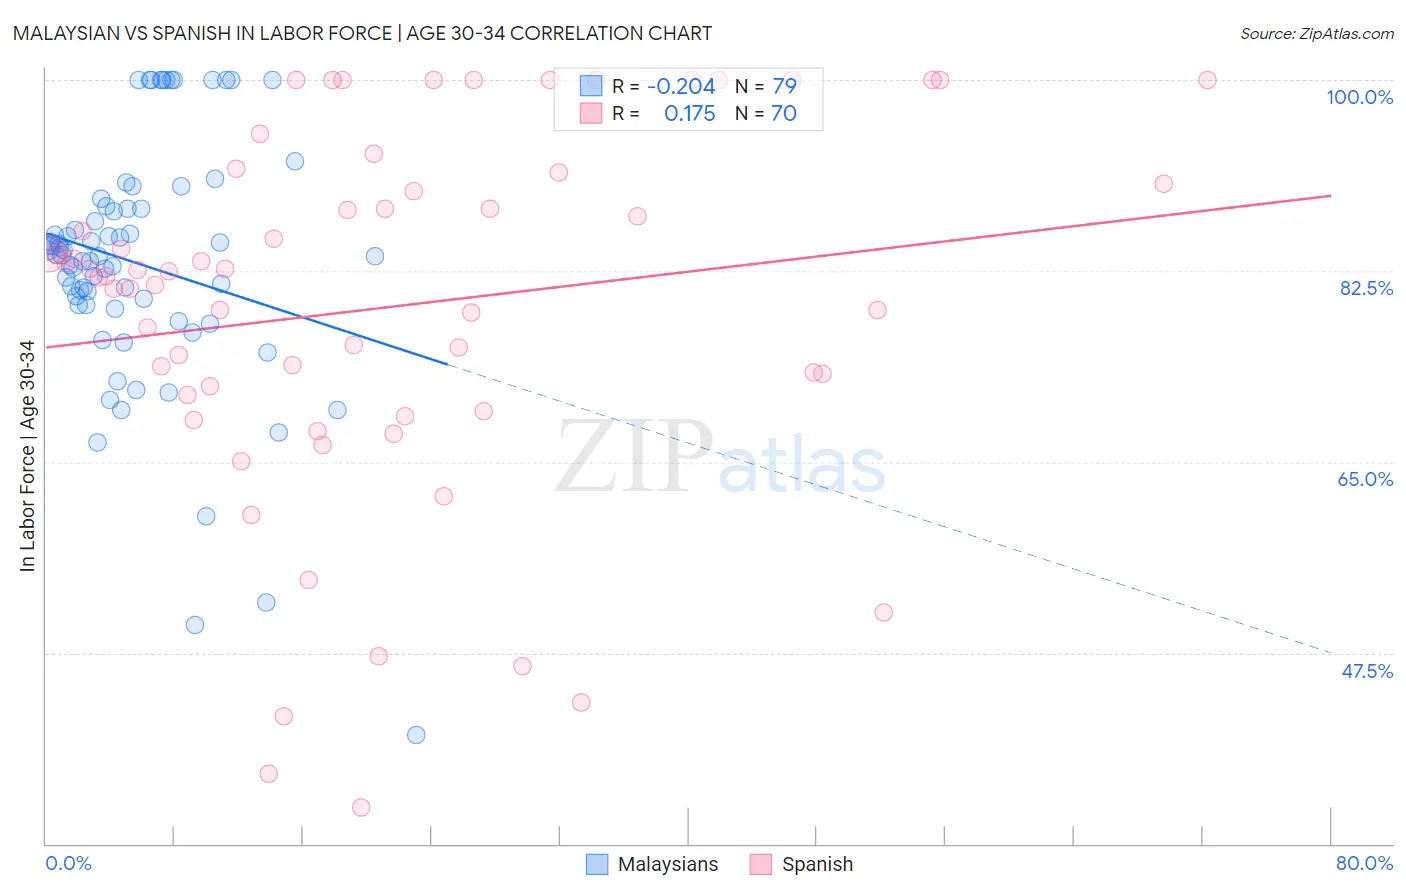
Malaysian vs Spanish In Labor Force | Age 30-34 Correlation Chart
The statistical analysis conducted on geographies consisting of 226,059,295 people shows a weak negative correlation between the proportion of Malaysians and labor force participation rate among population between the ages 30 and 34 in the United States with a correlation coefficient (R) of -0.204 and weighted average of 84.1%. Similarly, the statistical analysis conducted on geographies consisting of 421,842,107 people shows a poor positive correlation between the proportion of Spanish and labor force participation rate among population between the ages 30 and 34 in the United States with a correlation coefficient (R) of 0.175 and weighted average of 83.5%, a difference of 0.70%.
In Labor Force | Age 30-34 Correlation Summary
| Measurement | Malaysian | Spanish |
| Minimum | 40.0% | 33.3% |
| Maximum | 100.0% | 100.0% |
| Range | 60.0% | 66.7% |
| Mean | 83.1% | 79.2% |
| Median | 83.9% | 82.2% |
| Interquartile 25% (IQ1) | 79.4% | 71.1% |
| Interquartile 75% (IQ3) | 88.2% | 90.5% |
| Interquartile Range (IQR) | 8.8% | 19.4% |
| Standard Deviation (Sample) | 11.4% | 16.7% |
| Standard Deviation (Population) | 11.3% | 16.6% |
Similar Demographics by In Labor Force | Age 30-34
Demographics Similar to Malaysians by In Labor Force | Age 30-34
In terms of in labor force | age 30-34, the demographic groups most similar to Malaysians are Immigrants (84.1%, a difference of 0.020%), Immigrants from Bahamas (84.1%, a difference of 0.030%), West Indian (84.1%, a difference of 0.030%), Immigrants from Haiti (84.2%, a difference of 0.040%), and Welsh (84.2%, a difference of 0.040%).
| Demographics | Rating | Rank | In Labor Force | Age 30-34 |
| Cubans | 3.4 /100 | #224 | Tragic 84.2% |
| Scottish | 3.1 /100 | #225 | Tragic 84.2% |
| Immigrants | El Salvador | 3.0 /100 | #226 | Tragic 84.2% |
| Immigrants | Cuba | 3.0 /100 | #227 | Tragic 84.2% |
| Immigrants | Haiti | 2.8 /100 | #228 | Tragic 84.2% |
| Welsh | 2.7 /100 | #229 | Tragic 84.2% |
| Immigrants | Bahamas | 2.6 /100 | #230 | Tragic 84.1% |
| Malaysians | 2.2 /100 | #231 | Tragic 84.1% |
| Immigrants | Immigrants | 2.0 /100 | #232 | Tragic 84.1% |
| West Indians | 1.9 /100 | #233 | Tragic 84.1% |
| Haitians | 1.8 /100 | #234 | Tragic 84.1% |
| French American Indians | 1.7 /100 | #235 | Tragic 84.1% |
| U.S. Virgin Islanders | 1.5 /100 | #236 | Tragic 84.1% |
| Celtics | 1.4 /100 | #237 | Tragic 84.1% |
| Immigrants | Barbados | 1.4 /100 | #238 | Tragic 84.0% |
Demographics Similar to Spanish by In Labor Force | Age 30-34
In terms of in labor force | age 30-34, the demographic groups most similar to Spanish are Nonimmigrants (83.5%, a difference of 0.0%), Spanish American (83.5%, a difference of 0.020%), Guamanian/Chamorro (83.5%, a difference of 0.050%), Belizean (83.5%, a difference of 0.060%), and Vietnamese (83.6%, a difference of 0.070%).
| Demographics | Rating | Rank | In Labor Force | Age 30-34 |
| Guatemalans | 0.2 /100 | #264 | Tragic 83.7% |
| Immigrants | Honduras | 0.1 /100 | #265 | Tragic 83.7% |
| Immigrants | Guatemala | 0.1 /100 | #266 | Tragic 83.7% |
| Spaniards | 0.1 /100 | #267 | Tragic 83.6% |
| Immigrants | Bangladesh | 0.1 /100 | #268 | Tragic 83.6% |
| Vietnamese | 0.1 /100 | #269 | Tragic 83.6% |
| Spanish Americans | 0.0 /100 | #270 | Tragic 83.5% |
| Spanish | 0.0 /100 | #271 | Tragic 83.5% |
| Immigrants | Nonimmigrants | 0.0 /100 | #272 | Tragic 83.5% |
| Guamanians/Chamorros | 0.0 /100 | #273 | Tragic 83.5% |
| Belizeans | 0.0 /100 | #274 | Tragic 83.5% |
| Immigrants | Grenada | 0.0 /100 | #275 | Tragic 83.5% |
| Tongans | 0.0 /100 | #276 | Tragic 83.5% |
| Delaware | 0.0 /100 | #277 | Tragic 83.5% |
| Fijians | 0.0 /100 | #278 | Tragic 83.4% |