Malaysian vs Slovak In Labor Force | Age 30-34
COMPARE
Malaysian
Slovak
In Labor Force | Age 30-34
In Labor Force | Age 30-34 Comparison
Malaysians
Slovaks
84.1%
IN LABOR FORCE | AGE 30-34
2.2/ 100
METRIC RATING
231st/ 347
METRIC RANK
85.3%
IN LABOR FORCE | AGE 30-34
98.7/ 100
METRIC RATING
81st/ 347
METRIC RANK
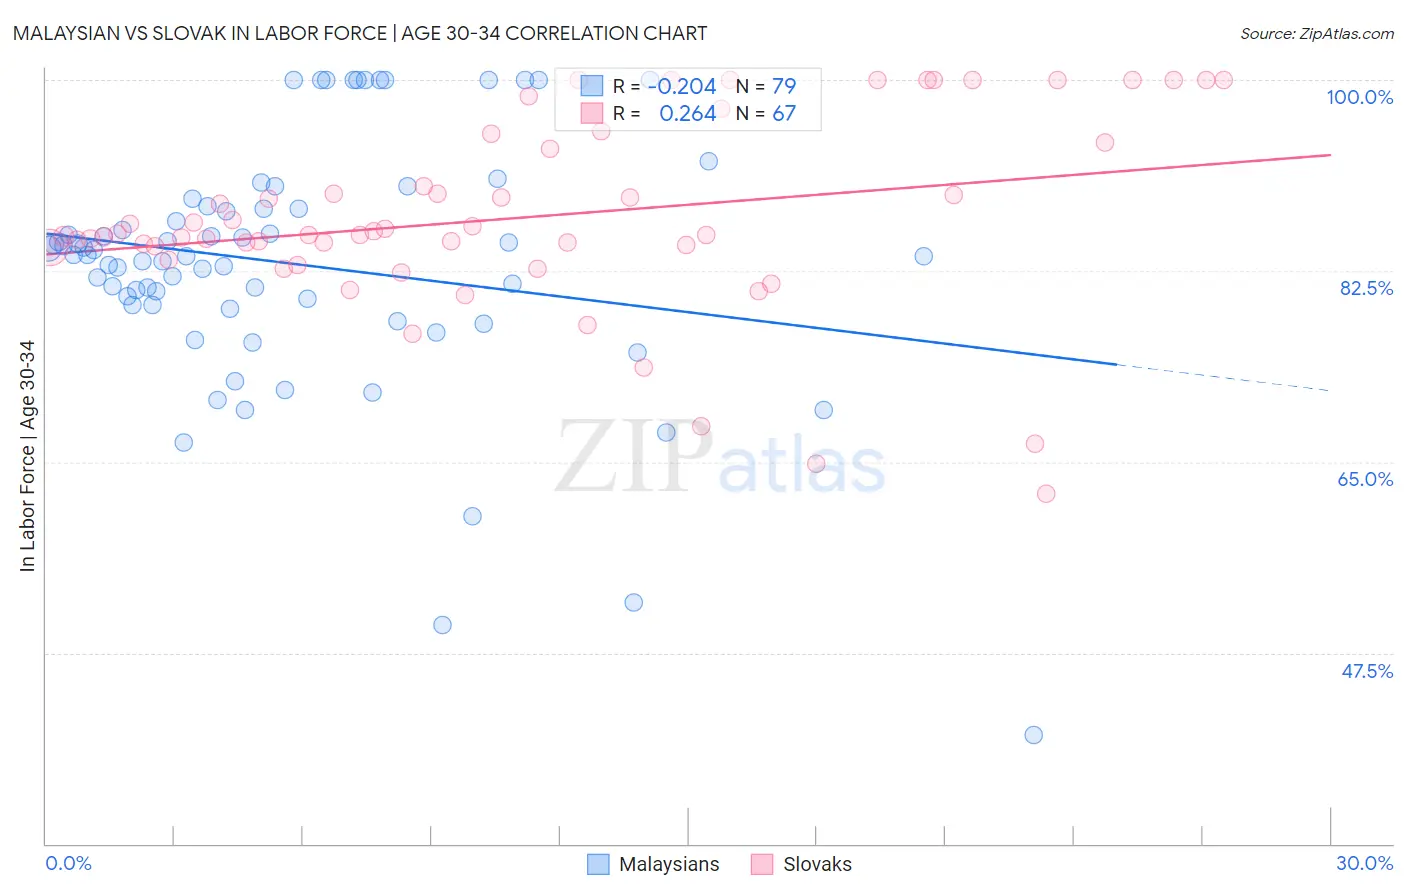
Malaysian vs Slovak In Labor Force | Age 30-34 Correlation Chart
The statistical analysis conducted on geographies consisting of 226,059,295 people shows a weak negative correlation between the proportion of Malaysians and labor force participation rate among population between the ages 30 and 34 in the United States with a correlation coefficient (R) of -0.204 and weighted average of 84.1%. Similarly, the statistical analysis conducted on geographies consisting of 397,592,817 people shows a weak positive correlation between the proportion of Slovaks and labor force participation rate among population between the ages 30 and 34 in the United States with a correlation coefficient (R) of 0.264 and weighted average of 85.3%, a difference of 1.4%.
In Labor Force | Age 30-34 Correlation Summary
| Measurement | Malaysian | Slovak |
| Minimum | 40.0% | 62.1% |
| Maximum | 100.0% | 100.0% |
| Range | 60.0% | 37.9% |
| Mean | 83.1% | 87.4% |
| Median | 83.9% | 85.8% |
| Interquartile 25% (IQ1) | 79.4% | 84.6% |
| Interquartile 75% (IQ3) | 88.2% | 94.3% |
| Interquartile Range (IQR) | 8.8% | 9.7% |
| Standard Deviation (Sample) | 11.4% | 8.8% |
| Standard Deviation (Population) | 11.3% | 8.7% |
Similar Demographics by In Labor Force | Age 30-34
Demographics Similar to Malaysians by In Labor Force | Age 30-34
In terms of in labor force | age 30-34, the demographic groups most similar to Malaysians are Immigrants (84.1%, a difference of 0.020%), Immigrants from Bahamas (84.1%, a difference of 0.030%), West Indian (84.1%, a difference of 0.030%), Immigrants from Haiti (84.2%, a difference of 0.040%), and Welsh (84.2%, a difference of 0.040%).
| Demographics | Rating | Rank | In Labor Force | Age 30-34 |
| Cubans | 3.4 /100 | #224 | Tragic 84.2% |
| Scottish | 3.1 /100 | #225 | Tragic 84.2% |
| Immigrants | El Salvador | 3.0 /100 | #226 | Tragic 84.2% |
| Immigrants | Cuba | 3.0 /100 | #227 | Tragic 84.2% |
| Immigrants | Haiti | 2.8 /100 | #228 | Tragic 84.2% |
| Welsh | 2.7 /100 | #229 | Tragic 84.2% |
| Immigrants | Bahamas | 2.6 /100 | #230 | Tragic 84.1% |
| Malaysians | 2.2 /100 | #231 | Tragic 84.1% |
| Immigrants | Immigrants | 2.0 /100 | #232 | Tragic 84.1% |
| West Indians | 1.9 /100 | #233 | Tragic 84.1% |
| Haitians | 1.8 /100 | #234 | Tragic 84.1% |
| French American Indians | 1.7 /100 | #235 | Tragic 84.1% |
| U.S. Virgin Islanders | 1.5 /100 | #236 | Tragic 84.1% |
| Celtics | 1.4 /100 | #237 | Tragic 84.1% |
| Immigrants | Barbados | 1.4 /100 | #238 | Tragic 84.0% |
Demographics Similar to Slovaks by In Labor Force | Age 30-34
In terms of in labor force | age 30-34, the demographic groups most similar to Slovaks are Immigrants from Switzerland (85.3%, a difference of 0.010%), Immigrants from Russia (85.3%, a difference of 0.010%), Immigrants from Africa (85.3%, a difference of 0.010%), Immigrants from Europe (85.3%, a difference of 0.010%), and Greek (85.3%, a difference of 0.010%).
| Demographics | Rating | Rank | In Labor Force | Age 30-34 |
| Maltese | 99.0 /100 | #74 | Exceptional 85.4% |
| Immigrants | Czechoslovakia | 99.0 /100 | #75 | Exceptional 85.4% |
| Iranians | 99.0 /100 | #76 | Exceptional 85.4% |
| Immigrants | Eastern Asia | 98.9 /100 | #77 | Exceptional 85.4% |
| Immigrants | Singapore | 98.8 /100 | #78 | Exceptional 85.3% |
| Immigrants | Switzerland | 98.7 /100 | #79 | Exceptional 85.3% |
| Immigrants | Russia | 98.7 /100 | #80 | Exceptional 85.3% |
| Slovaks | 98.7 /100 | #81 | Exceptional 85.3% |
| Immigrants | Africa | 98.6 /100 | #82 | Exceptional 85.3% |
| Immigrants | Europe | 98.6 /100 | #83 | Exceptional 85.3% |
| Greeks | 98.6 /100 | #84 | Exceptional 85.3% |
| Mongolians | 98.5 /100 | #85 | Exceptional 85.3% |
| Immigrants | Taiwan | 98.3 /100 | #86 | Exceptional 85.3% |
| Immigrants | Northern Europe | 98.2 /100 | #87 | Exceptional 85.3% |
| Immigrants | Belgium | 98.2 /100 | #88 | Exceptional 85.3% |