Lithuanian vs Chippewa In Labor Force | Age 20-64
COMPARE
Lithuanian
Chippewa
In Labor Force | Age 20-64
In Labor Force | Age 20-64 Comparison
Lithuanians
Chippewa
80.2%
IN LABOR FORCE | AGE 20-64
98.7/ 100
METRIC RATING
65th/ 347
METRIC RANK
77.3%
IN LABOR FORCE | AGE 20-64
0.0/ 100
METRIC RATING
303rd/ 347
METRIC RANK
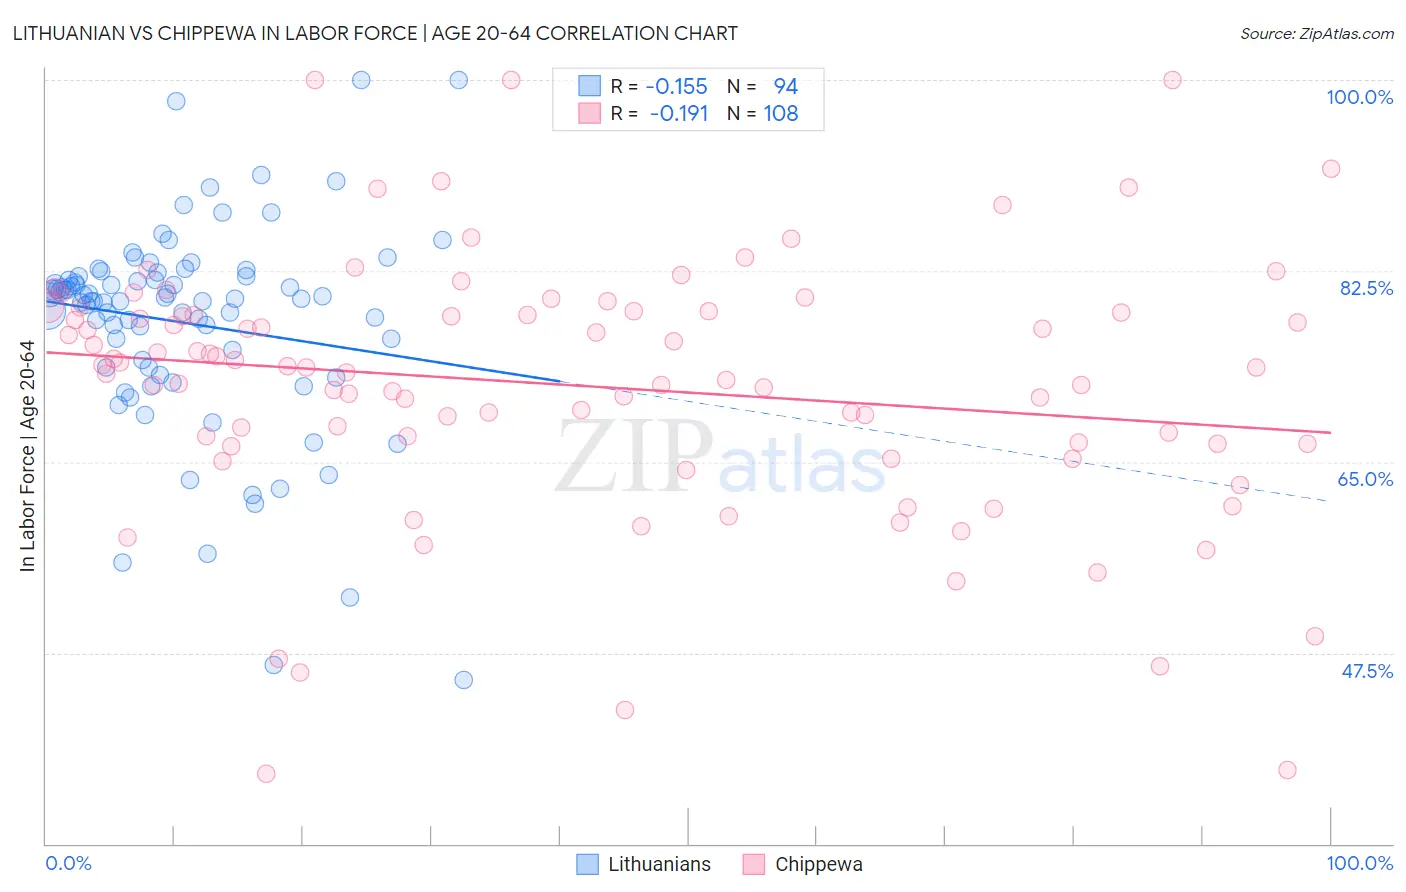
Lithuanian vs Chippewa In Labor Force | Age 20-64 Correlation Chart
The statistical analysis conducted on geographies consisting of 421,962,111 people shows a poor negative correlation between the proportion of Lithuanians and labor force participation rate among population between the ages 20 and 64 in the United States with a correlation coefficient (R) of -0.155 and weighted average of 80.2%. Similarly, the statistical analysis conducted on geographies consisting of 215,053,838 people shows a poor negative correlation between the proportion of Chippewa and labor force participation rate among population between the ages 20 and 64 in the United States with a correlation coefficient (R) of -0.191 and weighted average of 77.3%, a difference of 3.8%.
In Labor Force | Age 20-64 Correlation Summary
| Measurement | Lithuanian | Chippewa |
| Minimum | 45.0% | 36.4% |
| Maximum | 100.0% | 100.0% |
| Range | 55.0% | 63.6% |
| Mean | 77.7% | 72.0% |
| Median | 80.0% | 73.6% |
| Interquartile 25% (IQ1) | 73.7% | 66.7% |
| Interquartile 75% (IQ3) | 82.0% | 78.7% |
| Interquartile Range (IQR) | 8.3% | 12.0% |
| Standard Deviation (Sample) | 9.6% | 11.9% |
| Standard Deviation (Population) | 9.5% | 11.9% |
Similar Demographics by In Labor Force | Age 20-64
Demographics Similar to Lithuanians by In Labor Force | Age 20-64
In terms of in labor force | age 20-64, the demographic groups most similar to Lithuanians are Macedonian (80.2%, a difference of 0.0%), Immigrants from Korea (80.3%, a difference of 0.010%), Immigrants from Albania (80.3%, a difference of 0.010%), Taiwanese (80.2%, a difference of 0.010%), and Carpatho Rusyn (80.3%, a difference of 0.020%).
| Demographics | Rating | Rank | In Labor Force | Age 20-64 |
| Serbians | 98.9 /100 | #58 | Exceptional 80.3% |
| Swedes | 98.9 /100 | #59 | Exceptional 80.3% |
| Tongans | 98.8 /100 | #60 | Exceptional 80.3% |
| Burmese | 98.8 /100 | #61 | Exceptional 80.3% |
| Carpatho Rusyns | 98.8 /100 | #62 | Exceptional 80.3% |
| Immigrants | Korea | 98.8 /100 | #63 | Exceptional 80.3% |
| Immigrants | Albania | 98.7 /100 | #64 | Exceptional 80.3% |
| Lithuanians | 98.7 /100 | #65 | Exceptional 80.2% |
| Macedonians | 98.7 /100 | #66 | Exceptional 80.2% |
| Taiwanese | 98.6 /100 | #67 | Exceptional 80.2% |
| Bhutanese | 98.6 /100 | #68 | Exceptional 80.2% |
| Albanians | 98.6 /100 | #69 | Exceptional 80.2% |
| Immigrants | Turkey | 98.5 /100 | #70 | Exceptional 80.2% |
| Soviet Union | 98.5 /100 | #71 | Exceptional 80.2% |
| Eastern Europeans | 98.4 /100 | #72 | Exceptional 80.2% |
Demographics Similar to Chippewa by In Labor Force | Age 20-64
In terms of in labor force | age 20-64, the demographic groups most similar to Chippewa are Immigrants from Mexico (77.3%, a difference of 0.070%), Mexican (77.2%, a difference of 0.11%), Potawatomi (77.2%, a difference of 0.12%), Iroquois (77.5%, a difference of 0.22%), and Nepalese (77.5%, a difference of 0.27%).
| Demographics | Rating | Rank | In Labor Force | Age 20-64 |
| Immigrants | Dominican Republic | 0.0 /100 | #296 | Tragic 77.7% |
| Dominicans | 0.0 /100 | #297 | Tragic 77.7% |
| Cree | 0.0 /100 | #298 | Tragic 77.7% |
| Hispanics or Latinos | 0.0 /100 | #299 | Tragic 77.6% |
| Spanish American Indians | 0.0 /100 | #300 | Tragic 77.6% |
| Nepalese | 0.0 /100 | #301 | Tragic 77.5% |
| Iroquois | 0.0 /100 | #302 | Tragic 77.5% |
| Chippewa | 0.0 /100 | #303 | Tragic 77.3% |
| Immigrants | Mexico | 0.0 /100 | #304 | Tragic 77.3% |
| Mexicans | 0.0 /100 | #305 | Tragic 77.2% |
| Potawatomi | 0.0 /100 | #306 | Tragic 77.2% |
| Central American Indians | 0.0 /100 | #307 | Tragic 77.1% |
| Alaska Natives | 0.0 /100 | #308 | Tragic 77.0% |
| Americans | 0.0 /100 | #309 | Tragic 77.0% |
| Comanche | 0.0 /100 | #310 | Tragic 77.0% |