Immigrants from Sri Lanka vs Chippewa In Labor Force | Age 20-64
COMPARE
Immigrants from Sri Lanka
Chippewa
In Labor Force | Age 20-64
In Labor Force | Age 20-64 Comparison
Immigrants from Sri Lanka
Chippewa
80.4%
IN LABOR FORCE | AGE 20-64
99.3/ 100
METRIC RATING
51st/ 347
METRIC RANK
77.3%
IN LABOR FORCE | AGE 20-64
0.0/ 100
METRIC RATING
303rd/ 347
METRIC RANK
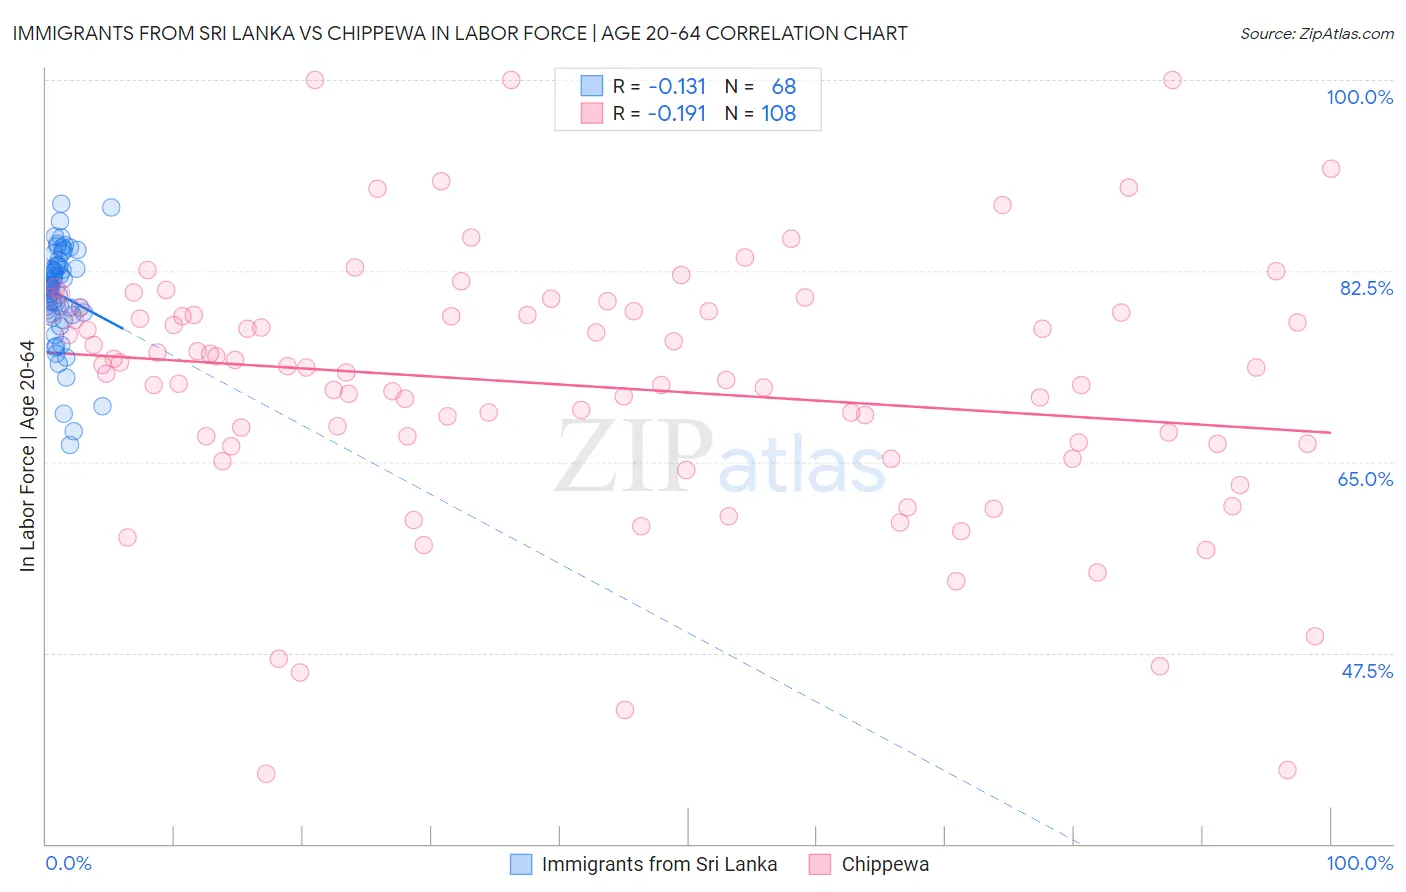
Immigrants from Sri Lanka vs Chippewa In Labor Force | Age 20-64 Correlation Chart
The statistical analysis conducted on geographies consisting of 149,698,668 people shows a poor negative correlation between the proportion of Immigrants from Sri Lanka and labor force participation rate among population between the ages 20 and 64 in the United States with a correlation coefficient (R) of -0.131 and weighted average of 80.4%. Similarly, the statistical analysis conducted on geographies consisting of 215,053,838 people shows a poor negative correlation between the proportion of Chippewa and labor force participation rate among population between the ages 20 and 64 in the United States with a correlation coefficient (R) of -0.191 and weighted average of 77.3%, a difference of 3.9%.
In Labor Force | Age 20-64 Correlation Summary
| Measurement | Immigrants from Sri Lanka | Chippewa |
| Minimum | 66.5% | 36.4% |
| Maximum | 88.7% | 100.0% |
| Range | 22.2% | 63.6% |
| Mean | 80.3% | 72.0% |
| Median | 81.0% | 73.6% |
| Interquartile 25% (IQ1) | 78.6% | 66.7% |
| Interquartile 75% (IQ3) | 83.0% | 78.7% |
| Interquartile Range (IQR) | 4.3% | 12.0% |
| Standard Deviation (Sample) | 4.4% | 11.9% |
| Standard Deviation (Population) | 4.4% | 11.9% |
Similar Demographics by In Labor Force | Age 20-64
Demographics Similar to Immigrants from Sri Lanka by In Labor Force | Age 20-64
In terms of in labor force | age 20-64, the demographic groups most similar to Immigrants from Sri Lanka are Turkish (80.3%, a difference of 0.020%), Immigrants from Sudan (80.4%, a difference of 0.030%), Immigrants from Peru (80.3%, a difference of 0.030%), Immigrants from Greece (80.4%, a difference of 0.040%), and Peruvian (80.3%, a difference of 0.040%).
| Demographics | Rating | Rank | In Labor Force | Age 20-64 |
| Immigrants | Middle Africa | 99.7 /100 | #44 | Exceptional 80.5% |
| Slovenes | 99.7 /100 | #45 | Exceptional 80.5% |
| Immigrants | Pakistan | 99.6 /100 | #46 | Exceptional 80.5% |
| Immigrants | Africa | 99.6 /100 | #47 | Exceptional 80.4% |
| Immigrants | Hong Kong | 99.5 /100 | #48 | Exceptional 80.4% |
| Immigrants | Greece | 99.4 /100 | #49 | Exceptional 80.4% |
| Immigrants | Sudan | 99.4 /100 | #50 | Exceptional 80.4% |
| Immigrants | Sri Lanka | 99.3 /100 | #51 | Exceptional 80.4% |
| Turks | 99.2 /100 | #52 | Exceptional 80.3% |
| Immigrants | Peru | 99.2 /100 | #53 | Exceptional 80.3% |
| Peruvians | 99.1 /100 | #54 | Exceptional 80.3% |
| Immigrants | Cabo Verde | 99.0 /100 | #55 | Exceptional 80.3% |
| Immigrants | Northern Africa | 99.0 /100 | #56 | Exceptional 80.3% |
| Afghans | 98.9 /100 | #57 | Exceptional 80.3% |
| Serbians | 98.9 /100 | #58 | Exceptional 80.3% |
Demographics Similar to Chippewa by In Labor Force | Age 20-64
In terms of in labor force | age 20-64, the demographic groups most similar to Chippewa are Immigrants from Mexico (77.3%, a difference of 0.070%), Mexican (77.2%, a difference of 0.11%), Potawatomi (77.2%, a difference of 0.12%), Iroquois (77.5%, a difference of 0.22%), and Nepalese (77.5%, a difference of 0.27%).
| Demographics | Rating | Rank | In Labor Force | Age 20-64 |
| Immigrants | Dominican Republic | 0.0 /100 | #296 | Tragic 77.7% |
| Dominicans | 0.0 /100 | #297 | Tragic 77.7% |
| Cree | 0.0 /100 | #298 | Tragic 77.7% |
| Hispanics or Latinos | 0.0 /100 | #299 | Tragic 77.6% |
| Spanish American Indians | 0.0 /100 | #300 | Tragic 77.6% |
| Nepalese | 0.0 /100 | #301 | Tragic 77.5% |
| Iroquois | 0.0 /100 | #302 | Tragic 77.5% |
| Chippewa | 0.0 /100 | #303 | Tragic 77.3% |
| Immigrants | Mexico | 0.0 /100 | #304 | Tragic 77.3% |
| Mexicans | 0.0 /100 | #305 | Tragic 77.2% |
| Potawatomi | 0.0 /100 | #306 | Tragic 77.2% |
| Central American Indians | 0.0 /100 | #307 | Tragic 77.1% |
| Alaska Natives | 0.0 /100 | #308 | Tragic 77.0% |
| Americans | 0.0 /100 | #309 | Tragic 77.0% |
| Comanche | 0.0 /100 | #310 | Tragic 77.0% |