Lithuanian vs Immigrants from Brazil In Labor Force | Age 20-64
COMPARE
Lithuanian
Immigrants from Brazil
In Labor Force | Age 20-64
In Labor Force | Age 20-64 Comparison
Lithuanians
Immigrants from Brazil
80.2%
IN LABOR FORCE | AGE 20-64
98.7/ 100
METRIC RATING
65th/ 347
METRIC RANK
80.7%
IN LABOR FORCE | AGE 20-64
99.9/ 100
METRIC RATING
34th/ 347
METRIC RANK
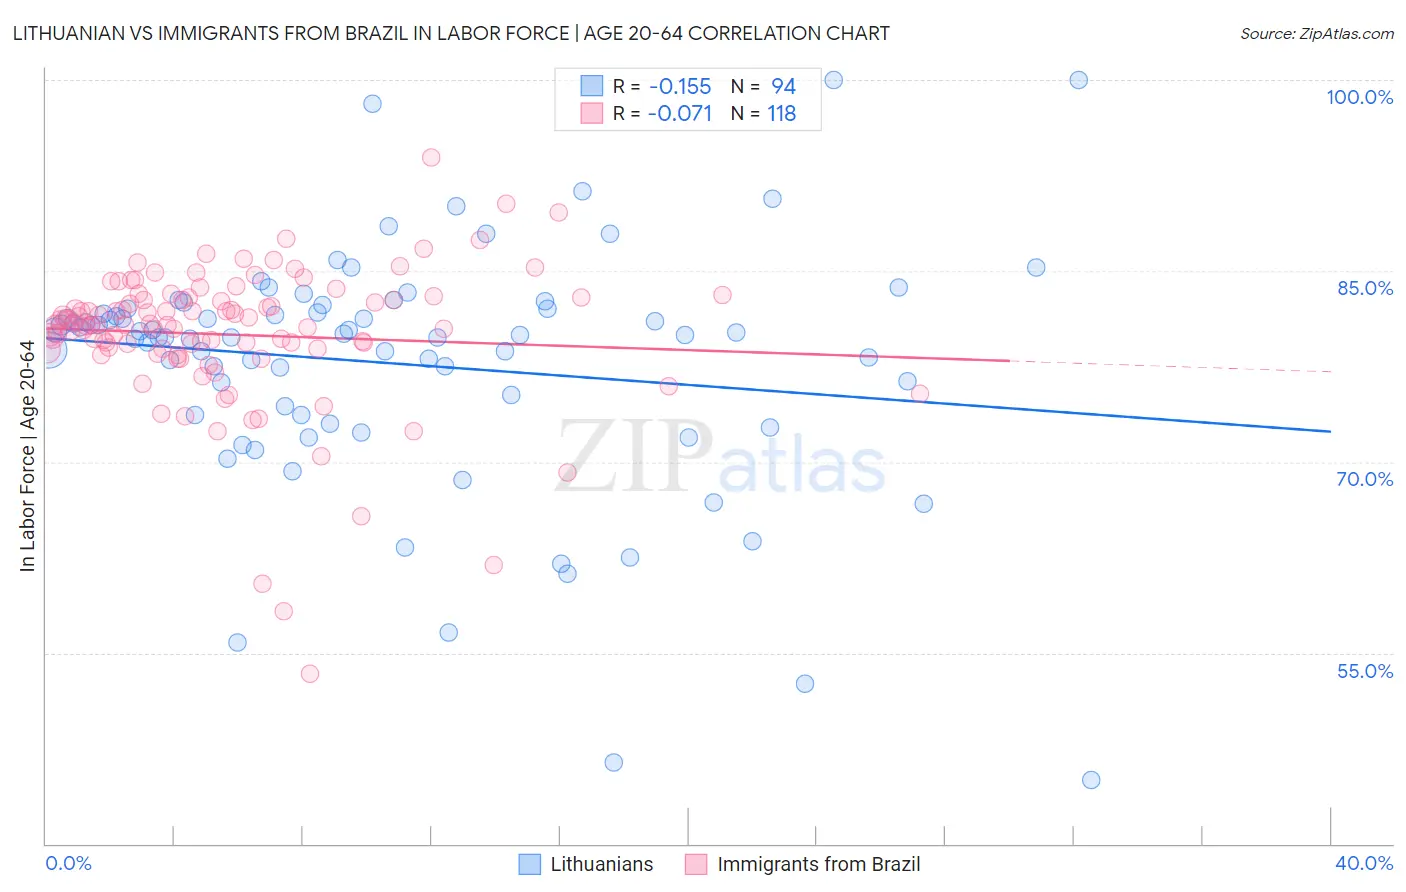
Lithuanian vs Immigrants from Brazil In Labor Force | Age 20-64 Correlation Chart
The statistical analysis conducted on geographies consisting of 421,962,111 people shows a poor negative correlation between the proportion of Lithuanians and labor force participation rate among population between the ages 20 and 64 in the United States with a correlation coefficient (R) of -0.155 and weighted average of 80.2%. Similarly, the statistical analysis conducted on geographies consisting of 343,008,665 people shows a slight negative correlation between the proportion of Immigrants from Brazil and labor force participation rate among population between the ages 20 and 64 in the United States with a correlation coefficient (R) of -0.071 and weighted average of 80.7%, a difference of 0.50%.
In Labor Force | Age 20-64 Correlation Summary
| Measurement | Lithuanian | Immigrants from Brazil |
| Minimum | 45.0% | 53.4% |
| Maximum | 100.0% | 93.9% |
| Range | 55.0% | 40.5% |
| Mean | 77.7% | 80.0% |
| Median | 80.0% | 80.8% |
| Interquartile 25% (IQ1) | 73.7% | 78.8% |
| Interquartile 75% (IQ3) | 82.0% | 82.9% |
| Interquartile Range (IQR) | 8.3% | 4.1% |
| Standard Deviation (Sample) | 9.6% | 5.8% |
| Standard Deviation (Population) | 9.5% | 5.8% |
Similar Demographics by In Labor Force | Age 20-64
Demographics Similar to Lithuanians by In Labor Force | Age 20-64
In terms of in labor force | age 20-64, the demographic groups most similar to Lithuanians are Macedonian (80.2%, a difference of 0.0%), Immigrants from Korea (80.3%, a difference of 0.010%), Immigrants from Albania (80.3%, a difference of 0.010%), Taiwanese (80.2%, a difference of 0.010%), and Carpatho Rusyn (80.3%, a difference of 0.020%).
| Demographics | Rating | Rank | In Labor Force | Age 20-64 |
| Serbians | 98.9 /100 | #58 | Exceptional 80.3% |
| Swedes | 98.9 /100 | #59 | Exceptional 80.3% |
| Tongans | 98.8 /100 | #60 | Exceptional 80.3% |
| Burmese | 98.8 /100 | #61 | Exceptional 80.3% |
| Carpatho Rusyns | 98.8 /100 | #62 | Exceptional 80.3% |
| Immigrants | Korea | 98.8 /100 | #63 | Exceptional 80.3% |
| Immigrants | Albania | 98.7 /100 | #64 | Exceptional 80.3% |
| Lithuanians | 98.7 /100 | #65 | Exceptional 80.2% |
| Macedonians | 98.7 /100 | #66 | Exceptional 80.2% |
| Taiwanese | 98.6 /100 | #67 | Exceptional 80.2% |
| Bhutanese | 98.6 /100 | #68 | Exceptional 80.2% |
| Albanians | 98.6 /100 | #69 | Exceptional 80.2% |
| Immigrants | Turkey | 98.5 /100 | #70 | Exceptional 80.2% |
| Soviet Union | 98.5 /100 | #71 | Exceptional 80.2% |
| Eastern Europeans | 98.4 /100 | #72 | Exceptional 80.2% |
Demographics Similar to Immigrants from Brazil by In Labor Force | Age 20-64
In terms of in labor force | age 20-64, the demographic groups most similar to Immigrants from Brazil are Chinese (80.7%, a difference of 0.020%), Immigrants from Poland (80.6%, a difference of 0.030%), Immigrants from Ireland (80.7%, a difference of 0.060%), Immigrants from Lithuania (80.7%, a difference of 0.070%), and Immigrants from South Central Asia (80.7%, a difference of 0.090%).
| Demographics | Rating | Rank | In Labor Force | Age 20-64 |
| Immigrants | Kenya | 99.9 /100 | #27 | Exceptional 80.7% |
| Immigrants | Uganda | 99.9 /100 | #28 | Exceptional 80.7% |
| Immigrants | South Central Asia | 99.9 /100 | #29 | Exceptional 80.7% |
| Immigrants | North Macedonia | 99.9 /100 | #30 | Exceptional 80.7% |
| Immigrants | Lithuania | 99.9 /100 | #31 | Exceptional 80.7% |
| Immigrants | Ireland | 99.9 /100 | #32 | Exceptional 80.7% |
| Chinese | 99.9 /100 | #33 | Exceptional 80.7% |
| Immigrants | Brazil | 99.9 /100 | #34 | Exceptional 80.7% |
| Immigrants | Poland | 99.9 /100 | #35 | Exceptional 80.6% |
| Paraguayans | 99.8 /100 | #36 | Exceptional 80.6% |
| Immigrants | Moldova | 99.8 /100 | #37 | Exceptional 80.6% |
| Ugandans | 99.8 /100 | #38 | Exceptional 80.6% |
| Brazilians | 99.8 /100 | #39 | Exceptional 80.5% |
| Immigrants | Zimbabwe | 99.8 /100 | #40 | Exceptional 80.5% |
| Immigrants | Liberia | 99.8 /100 | #41 | Exceptional 80.5% |