Argentinean vs Chippewa In Labor Force | Age 20-64
COMPARE
Argentinean
Chippewa
In Labor Force | Age 20-64
In Labor Force | Age 20-64 Comparison
Argentineans
Chippewa
80.0%
IN LABOR FORCE | AGE 20-64
93.8/ 100
METRIC RATING
114th/ 347
METRIC RANK
77.3%
IN LABOR FORCE | AGE 20-64
0.0/ 100
METRIC RATING
303rd/ 347
METRIC RANK
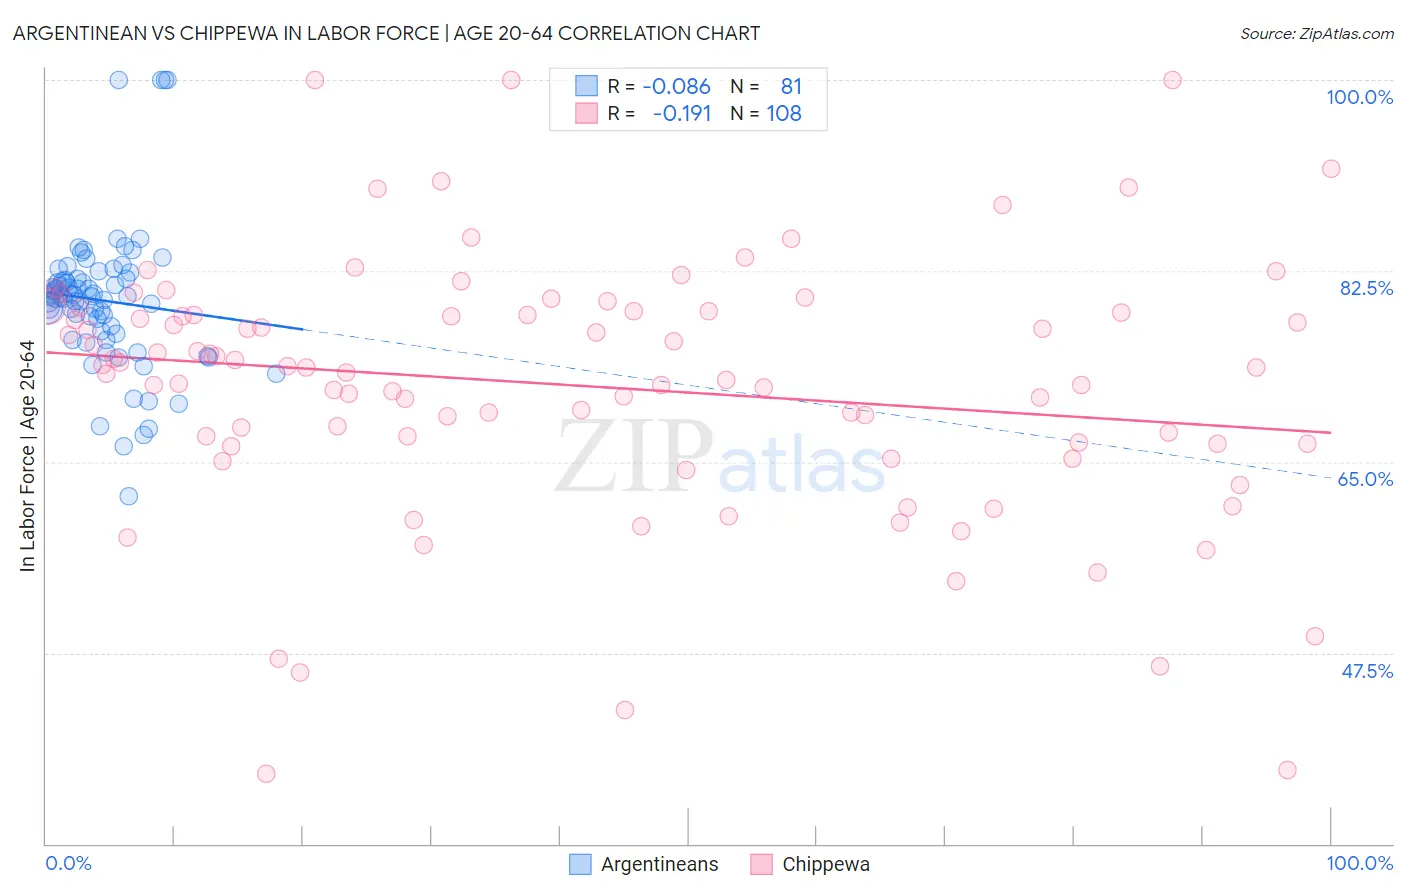
Argentinean vs Chippewa In Labor Force | Age 20-64 Correlation Chart
The statistical analysis conducted on geographies consisting of 297,148,532 people shows a slight negative correlation between the proportion of Argentineans and labor force participation rate among population between the ages 20 and 64 in the United States with a correlation coefficient (R) of -0.086 and weighted average of 80.0%. Similarly, the statistical analysis conducted on geographies consisting of 215,053,838 people shows a poor negative correlation between the proportion of Chippewa and labor force participation rate among population between the ages 20 and 64 in the United States with a correlation coefficient (R) of -0.191 and weighted average of 77.3%, a difference of 3.5%.
In Labor Force | Age 20-64 Correlation Summary
| Measurement | Argentinean | Chippewa |
| Minimum | 61.9% | 36.4% |
| Maximum | 100.0% | 100.0% |
| Range | 38.1% | 63.6% |
| Mean | 79.8% | 72.0% |
| Median | 80.2% | 73.6% |
| Interquartile 25% (IQ1) | 76.9% | 66.7% |
| Interquartile 75% (IQ3) | 81.8% | 78.7% |
| Interquartile Range (IQR) | 4.9% | 12.0% |
| Standard Deviation (Sample) | 6.5% | 11.9% |
| Standard Deviation (Population) | 6.5% | 11.9% |
Similar Demographics by In Labor Force | Age 20-64
Demographics Similar to Argentineans by In Labor Force | Age 20-64
In terms of in labor force | age 20-64, the demographic groups most similar to Argentineans are Immigrants from Italy (80.0%, a difference of 0.0%), Sri Lankan (80.0%, a difference of 0.0%), Immigrants from Argentina (80.0%, a difference of 0.010%), Estonian (80.0%, a difference of 0.010%), and Immigrants from South America (80.0%, a difference of 0.010%).
| Demographics | Rating | Rank | In Labor Force | Age 20-64 |
| Immigrants | Jordan | 94.8 /100 | #107 | Exceptional 80.0% |
| Iranians | 94.3 /100 | #108 | Exceptional 80.0% |
| Immigrants | Argentina | 94.1 /100 | #109 | Exceptional 80.0% |
| Estonians | 94.0 /100 | #110 | Exceptional 80.0% |
| Immigrants | South America | 93.9 /100 | #111 | Exceptional 80.0% |
| Immigrants | Italy | 93.9 /100 | #112 | Exceptional 80.0% |
| Sri Lankans | 93.9 /100 | #113 | Exceptional 80.0% |
| Argentineans | 93.8 /100 | #114 | Exceptional 80.0% |
| Bermudans | 93.3 /100 | #115 | Exceptional 80.0% |
| Immigrants | Western Africa | 93.1 /100 | #116 | Exceptional 80.0% |
| Immigrants | Vietnam | 92.7 /100 | #117 | Exceptional 80.0% |
| Cape Verdeans | 92.7 /100 | #118 | Exceptional 80.0% |
| Immigrants | Taiwan | 92.5 /100 | #119 | Exceptional 80.0% |
| Maltese | 92.4 /100 | #120 | Exceptional 80.0% |
| Immigrants | Kuwait | 92.2 /100 | #121 | Exceptional 80.0% |
Demographics Similar to Chippewa by In Labor Force | Age 20-64
In terms of in labor force | age 20-64, the demographic groups most similar to Chippewa are Immigrants from Mexico (77.3%, a difference of 0.070%), Mexican (77.2%, a difference of 0.11%), Potawatomi (77.2%, a difference of 0.12%), Iroquois (77.5%, a difference of 0.22%), and Nepalese (77.5%, a difference of 0.27%).
| Demographics | Rating | Rank | In Labor Force | Age 20-64 |
| Immigrants | Dominican Republic | 0.0 /100 | #296 | Tragic 77.7% |
| Dominicans | 0.0 /100 | #297 | Tragic 77.7% |
| Cree | 0.0 /100 | #298 | Tragic 77.7% |
| Hispanics or Latinos | 0.0 /100 | #299 | Tragic 77.6% |
| Spanish American Indians | 0.0 /100 | #300 | Tragic 77.6% |
| Nepalese | 0.0 /100 | #301 | Tragic 77.5% |
| Iroquois | 0.0 /100 | #302 | Tragic 77.5% |
| Chippewa | 0.0 /100 | #303 | Tragic 77.3% |
| Immigrants | Mexico | 0.0 /100 | #304 | Tragic 77.3% |
| Mexicans | 0.0 /100 | #305 | Tragic 77.2% |
| Potawatomi | 0.0 /100 | #306 | Tragic 77.2% |
| Central American Indians | 0.0 /100 | #307 | Tragic 77.1% |
| Alaska Natives | 0.0 /100 | #308 | Tragic 77.0% |
| Americans | 0.0 /100 | #309 | Tragic 77.0% |
| Comanche | 0.0 /100 | #310 | Tragic 77.0% |