Immigrants from Romania vs Chippewa In Labor Force | Age 20-64
COMPARE
Immigrants from Romania
Chippewa
In Labor Force | Age 20-64
In Labor Force | Age 20-64 Comparison
Immigrants from Romania
Chippewa
80.2%
IN LABOR FORCE | AGE 20-64
97.8/ 100
METRIC RATING
78th/ 347
METRIC RANK
77.3%
IN LABOR FORCE | AGE 20-64
0.0/ 100
METRIC RATING
303rd/ 347
METRIC RANK
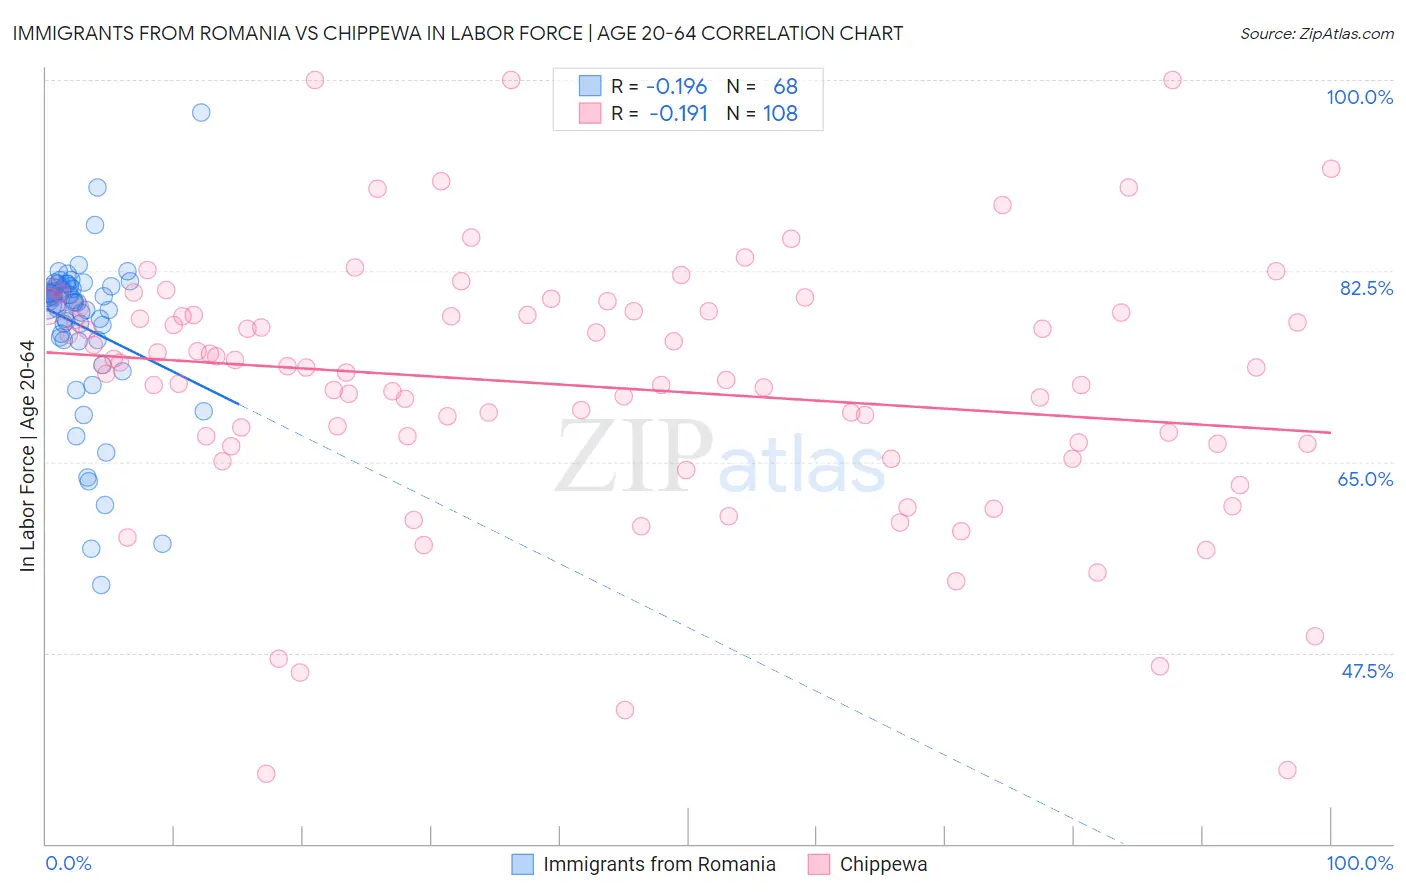
Immigrants from Romania vs Chippewa In Labor Force | Age 20-64 Correlation Chart
The statistical analysis conducted on geographies consisting of 257,013,764 people shows a poor negative correlation between the proportion of Immigrants from Romania and labor force participation rate among population between the ages 20 and 64 in the United States with a correlation coefficient (R) of -0.196 and weighted average of 80.2%. Similarly, the statistical analysis conducted on geographies consisting of 215,053,838 people shows a poor negative correlation between the proportion of Chippewa and labor force participation rate among population between the ages 20 and 64 in the United States with a correlation coefficient (R) of -0.191 and weighted average of 77.3%, a difference of 3.7%.
In Labor Force | Age 20-64 Correlation Summary
| Measurement | Immigrants from Romania | Chippewa |
| Minimum | 53.7% | 36.4% |
| Maximum | 97.0% | 100.0% |
| Range | 43.3% | 63.6% |
| Mean | 77.4% | 72.0% |
| Median | 79.7% | 73.6% |
| Interquartile 25% (IQ1) | 76.3% | 66.7% |
| Interquartile 75% (IQ3) | 81.0% | 78.7% |
| Interquartile Range (IQR) | 4.8% | 12.0% |
| Standard Deviation (Sample) | 7.3% | 11.9% |
| Standard Deviation (Population) | 7.3% | 11.9% |
Similar Demographics by In Labor Force | Age 20-64
Demographics Similar to Immigrants from Romania by In Labor Force | Age 20-64
In terms of in labor force | age 20-64, the demographic groups most similar to Immigrants from Romania are Egyptian (80.2%, a difference of 0.0%), Immigrants from Colombia (80.2%, a difference of 0.0%), Immigrants from Afghanistan (80.2%, a difference of 0.010%), Asian (80.2%, a difference of 0.010%), and Immigrants from Croatia (80.1%, a difference of 0.020%).
| Demographics | Rating | Rank | In Labor Force | Age 20-64 |
| Soviet Union | 98.5 /100 | #71 | Exceptional 80.2% |
| Eastern Europeans | 98.4 /100 | #72 | Exceptional 80.2% |
| Cypriots | 98.2 /100 | #73 | Exceptional 80.2% |
| Immigrants | Eastern Europe | 98.1 /100 | #74 | Exceptional 80.2% |
| Immigrants | Afghanistan | 97.9 /100 | #75 | Exceptional 80.2% |
| Egyptians | 97.8 /100 | #76 | Exceptional 80.2% |
| Immigrants | Colombia | 97.8 /100 | #77 | Exceptional 80.2% |
| Immigrants | Romania | 97.8 /100 | #78 | Exceptional 80.2% |
| Asians | 97.7 /100 | #79 | Exceptional 80.2% |
| Immigrants | Croatia | 97.6 /100 | #80 | Exceptional 80.1% |
| German Russians | 97.3 /100 | #81 | Exceptional 80.1% |
| Immigrants | Japan | 97.3 /100 | #82 | Exceptional 80.1% |
| Colombians | 97.3 /100 | #83 | Exceptional 80.1% |
| Immigrants | Latvia | 97.2 /100 | #84 | Exceptional 80.1% |
| Jordanians | 97.2 /100 | #85 | Exceptional 80.1% |
Demographics Similar to Chippewa by In Labor Force | Age 20-64
In terms of in labor force | age 20-64, the demographic groups most similar to Chippewa are Immigrants from Mexico (77.3%, a difference of 0.070%), Mexican (77.2%, a difference of 0.11%), Potawatomi (77.2%, a difference of 0.12%), Iroquois (77.5%, a difference of 0.22%), and Nepalese (77.5%, a difference of 0.27%).
| Demographics | Rating | Rank | In Labor Force | Age 20-64 |
| Immigrants | Dominican Republic | 0.0 /100 | #296 | Tragic 77.7% |
| Dominicans | 0.0 /100 | #297 | Tragic 77.7% |
| Cree | 0.0 /100 | #298 | Tragic 77.7% |
| Hispanics or Latinos | 0.0 /100 | #299 | Tragic 77.6% |
| Spanish American Indians | 0.0 /100 | #300 | Tragic 77.6% |
| Nepalese | 0.0 /100 | #301 | Tragic 77.5% |
| Iroquois | 0.0 /100 | #302 | Tragic 77.5% |
| Chippewa | 0.0 /100 | #303 | Tragic 77.3% |
| Immigrants | Mexico | 0.0 /100 | #304 | Tragic 77.3% |
| Mexicans | 0.0 /100 | #305 | Tragic 77.2% |
| Potawatomi | 0.0 /100 | #306 | Tragic 77.2% |
| Central American Indians | 0.0 /100 | #307 | Tragic 77.1% |
| Alaska Natives | 0.0 /100 | #308 | Tragic 77.0% |
| Americans | 0.0 /100 | #309 | Tragic 77.0% |
| Comanche | 0.0 /100 | #310 | Tragic 77.0% |