New Zealander vs Chippewa In Labor Force | Age 20-64
COMPARE
New Zealander
Chippewa
In Labor Force | Age 20-64
In Labor Force | Age 20-64 Comparison
New Zealanders
Chippewa
79.7%
IN LABOR FORCE | AGE 20-64
69.4/ 100
METRIC RATING
154th/ 347
METRIC RANK
77.3%
IN LABOR FORCE | AGE 20-64
0.0/ 100
METRIC RATING
303rd/ 347
METRIC RANK
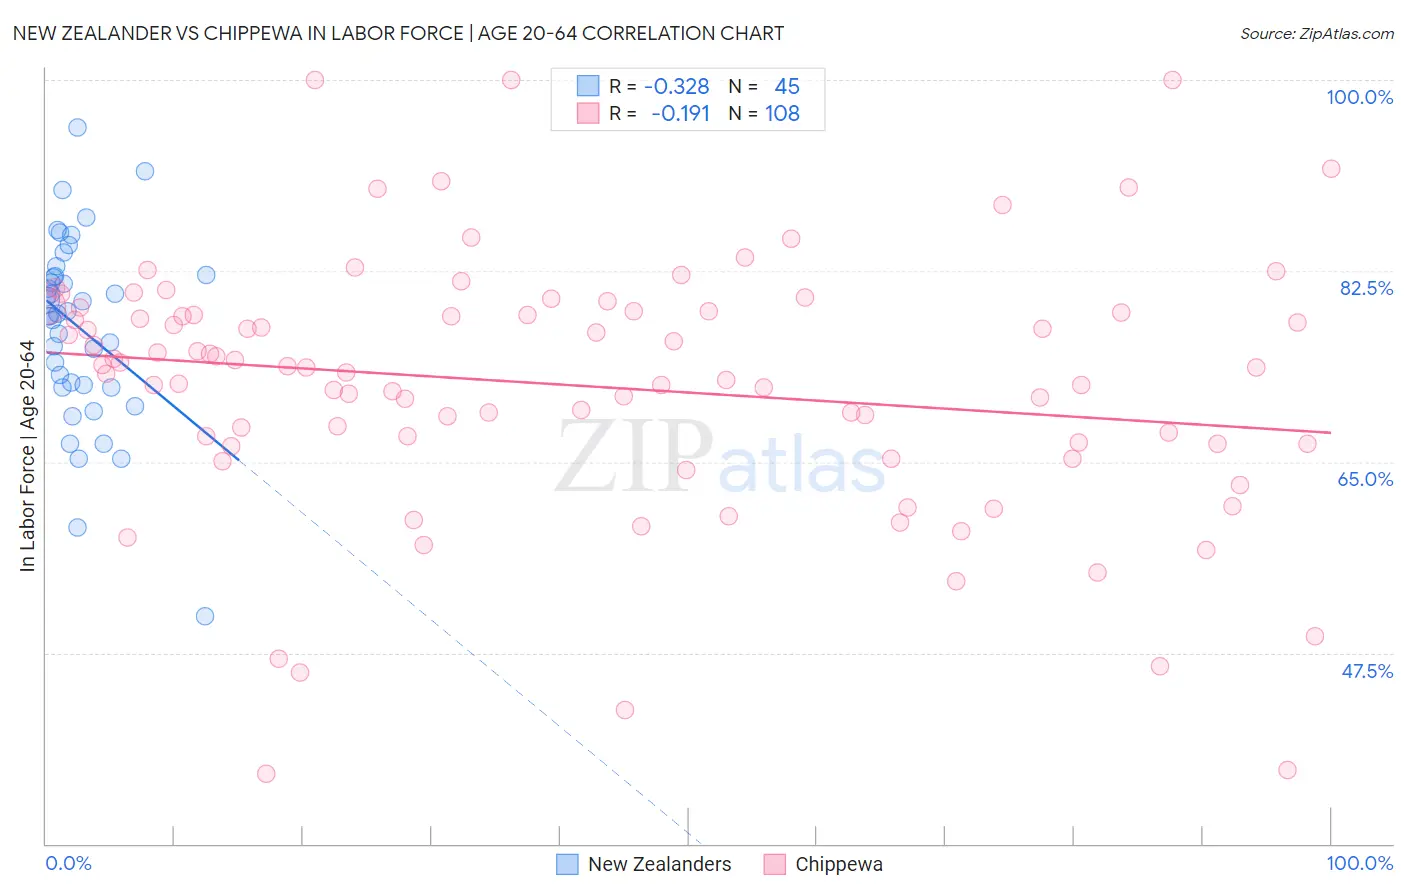
New Zealander vs Chippewa In Labor Force | Age 20-64 Correlation Chart
The statistical analysis conducted on geographies consisting of 106,923,900 people shows a mild negative correlation between the proportion of New Zealanders and labor force participation rate among population between the ages 20 and 64 in the United States with a correlation coefficient (R) of -0.328 and weighted average of 79.7%. Similarly, the statistical analysis conducted on geographies consisting of 215,053,838 people shows a poor negative correlation between the proportion of Chippewa and labor force participation rate among population between the ages 20 and 64 in the United States with a correlation coefficient (R) of -0.191 and weighted average of 77.3%, a difference of 3.1%.
In Labor Force | Age 20-64 Correlation Summary
| Measurement | New Zealander | Chippewa |
| Minimum | 50.8% | 36.4% |
| Maximum | 95.6% | 100.0% |
| Range | 44.8% | 63.6% |
| Mean | 77.3% | 72.0% |
| Median | 78.6% | 73.6% |
| Interquartile 25% (IQ1) | 72.0% | 66.7% |
| Interquartile 75% (IQ3) | 82.1% | 78.7% |
| Interquartile Range (IQR) | 10.1% | 12.0% |
| Standard Deviation (Sample) | 8.5% | 11.9% |
| Standard Deviation (Population) | 8.4% | 11.9% |
Similar Demographics by In Labor Force | Age 20-64
Demographics Similar to New Zealanders by In Labor Force | Age 20-64
In terms of in labor force | age 20-64, the demographic groups most similar to New Zealanders are Immigrants from Kazakhstan (79.7%, a difference of 0.0%), Immigrants from South Africa (79.7%, a difference of 0.0%), Senegalese (79.7%, a difference of 0.0%), Immigrants from China (79.7%, a difference of 0.0%), and Immigrants from Northern Europe (79.7%, a difference of 0.020%).
| Demographics | Rating | Rank | In Labor Force | Age 20-64 |
| Immigrants | Philippines | 78.0 /100 | #147 | Good 79.8% |
| Romanians | 77.6 /100 | #148 | Good 79.8% |
| Icelanders | 75.1 /100 | #149 | Good 79.7% |
| Costa Ricans | 72.4 /100 | #150 | Good 79.7% |
| Scandinavians | 72.0 /100 | #151 | Good 79.7% |
| Immigrants | Northern Europe | 72.0 /100 | #152 | Good 79.7% |
| Immigrants | Kazakhstan | 69.5 /100 | #153 | Good 79.7% |
| New Zealanders | 69.4 /100 | #154 | Good 79.7% |
| Immigrants | South Africa | 69.2 /100 | #155 | Good 79.7% |
| Senegalese | 69.1 /100 | #156 | Good 79.7% |
| Immigrants | China | 69.1 /100 | #157 | Good 79.7% |
| Austrians | 67.6 /100 | #158 | Good 79.7% |
| Immigrants | Cuba | 66.7 /100 | #159 | Good 79.7% |
| Moroccans | 66.7 /100 | #160 | Good 79.7% |
| South Africans | 66.2 /100 | #161 | Good 79.7% |
Demographics Similar to Chippewa by In Labor Force | Age 20-64
In terms of in labor force | age 20-64, the demographic groups most similar to Chippewa are Immigrants from Mexico (77.3%, a difference of 0.070%), Mexican (77.2%, a difference of 0.11%), Potawatomi (77.2%, a difference of 0.12%), Iroquois (77.5%, a difference of 0.22%), and Nepalese (77.5%, a difference of 0.27%).
| Demographics | Rating | Rank | In Labor Force | Age 20-64 |
| Immigrants | Dominican Republic | 0.0 /100 | #296 | Tragic 77.7% |
| Dominicans | 0.0 /100 | #297 | Tragic 77.7% |
| Cree | 0.0 /100 | #298 | Tragic 77.7% |
| Hispanics or Latinos | 0.0 /100 | #299 | Tragic 77.6% |
| Spanish American Indians | 0.0 /100 | #300 | Tragic 77.6% |
| Nepalese | 0.0 /100 | #301 | Tragic 77.5% |
| Iroquois | 0.0 /100 | #302 | Tragic 77.5% |
| Chippewa | 0.0 /100 | #303 | Tragic 77.3% |
| Immigrants | Mexico | 0.0 /100 | #304 | Tragic 77.3% |
| Mexicans | 0.0 /100 | #305 | Tragic 77.2% |
| Potawatomi | 0.0 /100 | #306 | Tragic 77.2% |
| Central American Indians | 0.0 /100 | #307 | Tragic 77.1% |
| Alaska Natives | 0.0 /100 | #308 | Tragic 77.0% |
| Americans | 0.0 /100 | #309 | Tragic 77.0% |
| Comanche | 0.0 /100 | #310 | Tragic 77.0% |