Kiowa vs Immigrants from Trinidad and Tobago In Labor Force | Age 20-24
COMPARE
Kiowa
Immigrants from Trinidad and Tobago
In Labor Force | Age 20-24
In Labor Force | Age 20-24 Comparison
Kiowa
Immigrants from Trinidad and Tobago
73.2%
IN LABOR FORCE | AGE 20-24
0.1/ 100
METRIC RATING
284th/ 347
METRIC RANK
71.1%
IN LABOR FORCE | AGE 20-24
0.0/ 100
METRIC RATING
327th/ 347
METRIC RANK
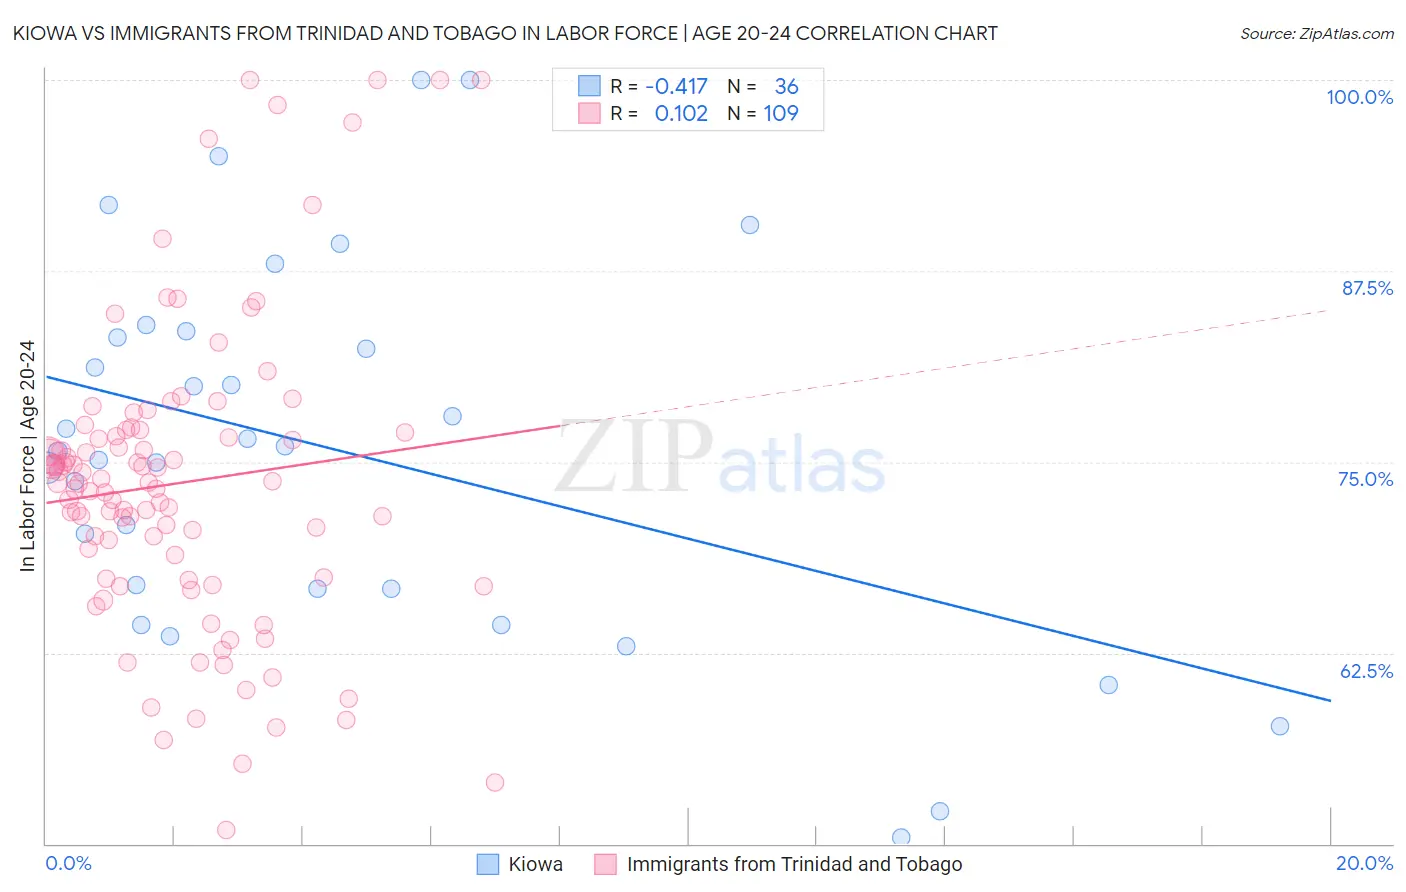
Kiowa vs Immigrants from Trinidad and Tobago In Labor Force | Age 20-24 Correlation Chart
The statistical analysis conducted on geographies consisting of 56,096,922 people shows a moderate negative correlation between the proportion of Kiowa and labor force participation rate among population between the ages 20 and 24 in the United States with a correlation coefficient (R) of -0.417 and weighted average of 73.2%. Similarly, the statistical analysis conducted on geographies consisting of 223,471,957 people shows a poor positive correlation between the proportion of Immigrants from Trinidad and Tobago and labor force participation rate among population between the ages 20 and 24 in the United States with a correlation coefficient (R) of 0.102 and weighted average of 71.1%, a difference of 3.0%.
In Labor Force | Age 20-24 Correlation Summary
| Measurement | Kiowa | Immigrants from Trinidad and Tobago |
| Minimum | 50.4% | 50.9% |
| Maximum | 100.0% | 100.0% |
| Range | 49.6% | 49.1% |
| Mean | 75.8% | 73.6% |
| Median | 75.9% | 73.6% |
| Interquartile 25% (IQ1) | 66.7% | 67.4% |
| Interquartile 75% (IQ3) | 83.3% | 77.0% |
| Interquartile Range (IQR) | 16.6% | 9.6% |
| Standard Deviation (Sample) | 12.3% | 10.0% |
| Standard Deviation (Population) | 12.1% | 9.9% |
Similar Demographics by In Labor Force | Age 20-24
Demographics Similar to Kiowa by In Labor Force | Age 20-24
In terms of in labor force | age 20-24, the demographic groups most similar to Kiowa are Immigrants from Bahamas (73.2%, a difference of 0.020%), Immigrants from Spain (73.2%, a difference of 0.030%), Immigrants from Venezuela (73.2%, a difference of 0.040%), Nicaraguan (73.2%, a difference of 0.060%), and Bahamian (73.3%, a difference of 0.070%).
| Demographics | Rating | Rank | In Labor Force | Age 20-24 |
| Immigrants | Malaysia | 0.2 /100 | #277 | Tragic 73.3% |
| Cypriots | 0.2 /100 | #278 | Tragic 73.3% |
| Venezuelans | 0.2 /100 | #279 | Tragic 73.3% |
| Bahamians | 0.1 /100 | #280 | Tragic 73.3% |
| Immigrants | Venezuela | 0.1 /100 | #281 | Tragic 73.2% |
| Immigrants | Spain | 0.1 /100 | #282 | Tragic 73.2% |
| Immigrants | Bahamas | 0.1 /100 | #283 | Tragic 73.2% |
| Kiowa | 0.1 /100 | #284 | Tragic 73.2% |
| Nicaraguans | 0.1 /100 | #285 | Tragic 73.2% |
| Immigrants | Lebanon | 0.1 /100 | #286 | Tragic 73.1% |
| Immigrants | Korea | 0.1 /100 | #287 | Tragic 73.1% |
| Argentineans | 0.1 /100 | #288 | Tragic 73.1% |
| U.S. Virgin Islanders | 0.1 /100 | #289 | Tragic 73.0% |
| Immigrants | Belarus | 0.1 /100 | #290 | Tragic 73.0% |
| Immigrants | Nicaragua | 0.0 /100 | #291 | Tragic 72.9% |
Demographics Similar to Immigrants from Trinidad and Tobago by In Labor Force | Age 20-24
In terms of in labor force | age 20-24, the demographic groups most similar to Immigrants from Trinidad and Tobago are Dominican (71.1%, a difference of 0.0%), Immigrants from China (71.1%, a difference of 0.020%), Barbadian (71.1%, a difference of 0.090%), Immigrants from Dominican Republic (71.2%, a difference of 0.19%), and Yup'ik (70.9%, a difference of 0.26%).
| Demographics | Rating | Rank | In Labor Force | Age 20-24 |
| Trinidadians and Tobagonians | 0.0 /100 | #320 | Tragic 71.5% |
| Immigrants | Taiwan | 0.0 /100 | #321 | Tragic 71.5% |
| Filipinos | 0.0 /100 | #322 | Tragic 71.4% |
| West Indians | 0.0 /100 | #323 | Tragic 71.3% |
| Immigrants | Dominican Republic | 0.0 /100 | #324 | Tragic 71.2% |
| Barbadians | 0.0 /100 | #325 | Tragic 71.1% |
| Dominicans | 0.0 /100 | #326 | Tragic 71.1% |
| Immigrants | Trinidad and Tobago | 0.0 /100 | #327 | Tragic 71.1% |
| Immigrants | China | 0.0 /100 | #328 | Tragic 71.1% |
| Yup'ik | 0.0 /100 | #329 | Tragic 70.9% |
| Vietnamese | 0.0 /100 | #330 | Tragic 70.6% |
| Immigrants | Bangladesh | 0.0 /100 | #331 | Tragic 70.6% |
| Immigrants | Uzbekistan | 0.0 /100 | #332 | Tragic 70.4% |
| Yuman | 0.0 /100 | #333 | Tragic 70.3% |
| British West Indians | 0.0 /100 | #334 | Tragic 70.0% |