Kiowa vs Immigrants from Senegal Doctorate Degree
COMPARE
Kiowa
Immigrants from Senegal
Doctorate Degree
Doctorate Degree Comparison
Kiowa
Immigrants from Senegal
1.5%
DOCTORATE DEGREE
0.5/ 100
METRIC RATING
267th/ 347
METRIC RANK
1.9%
DOCTORATE DEGREE
82.5/ 100
METRIC RATING
147th/ 347
METRIC RANK
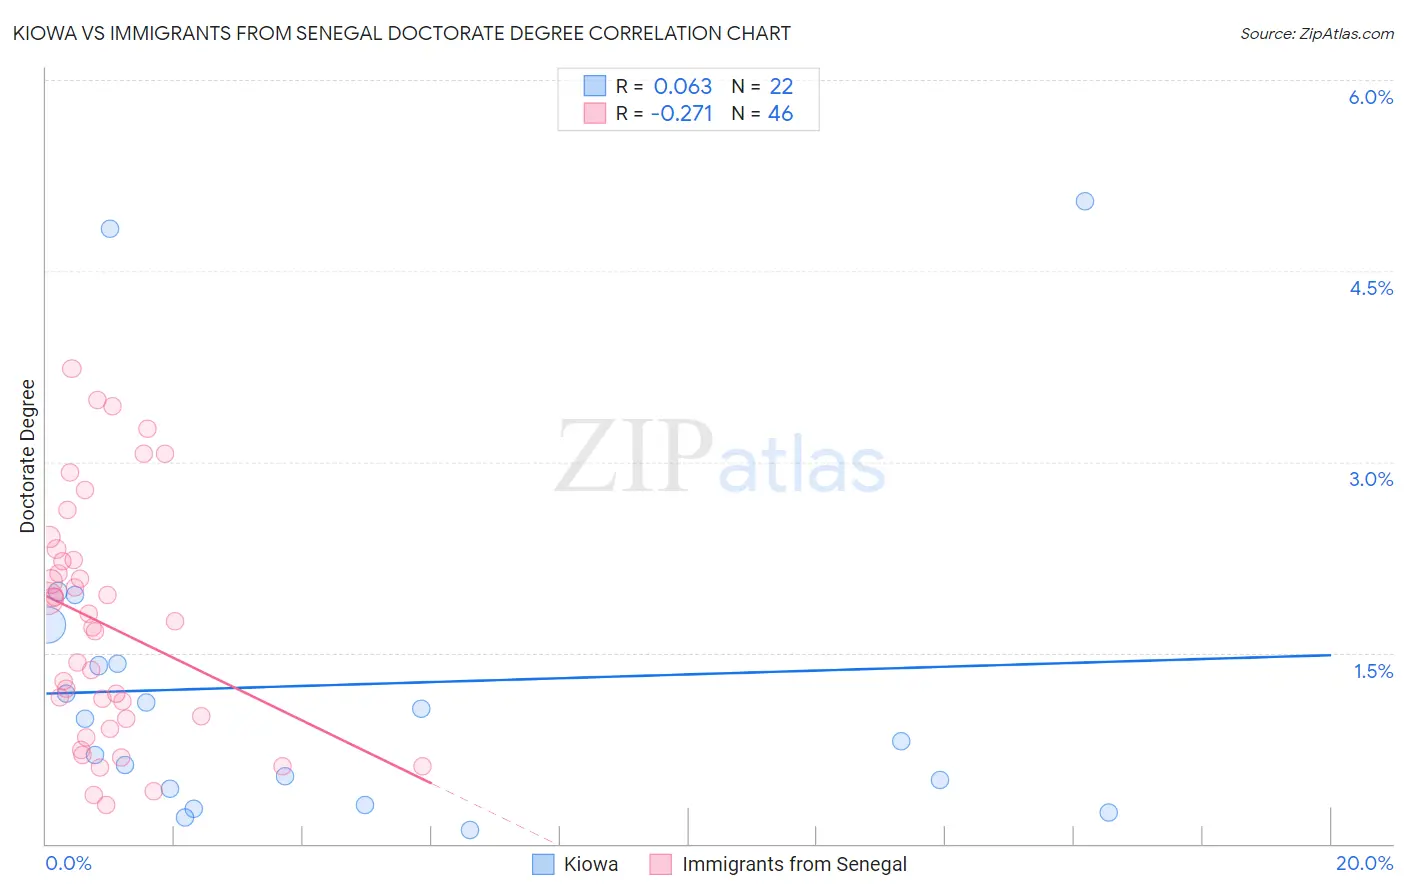
Kiowa vs Immigrants from Senegal Doctorate Degree Correlation Chart
The statistical analysis conducted on geographies consisting of 55,816,646 people shows a slight positive correlation between the proportion of Kiowa and percentage of population with at least doctorate degree education in the United States with a correlation coefficient (R) of 0.063 and weighted average of 1.5%. Similarly, the statistical analysis conducted on geographies consisting of 89,977,778 people shows a weak negative correlation between the proportion of Immigrants from Senegal and percentage of population with at least doctorate degree education in the United States with a correlation coefficient (R) of -0.271 and weighted average of 1.9%, a difference of 31.4%.
Doctorate Degree Correlation Summary
| Measurement | Kiowa | Immigrants from Senegal |
| Minimum | 0.10% | 0.31% |
| Maximum | 5.1% | 3.7% |
| Range | 4.9% | 3.4% |
| Mean | 1.2% | 1.7% |
| Median | 0.90% | 1.7% |
| Interquartile 25% (IQ1) | 0.44% | 0.98% |
| Interquartile 75% (IQ3) | 1.4% | 2.2% |
| Interquartile Range (IQR) | 0.98% | 1.2% |
| Standard Deviation (Sample) | 1.3% | 0.92% |
| Standard Deviation (Population) | 1.3% | 0.91% |
Similar Demographics by Doctorate Degree
Demographics Similar to Kiowa by Doctorate Degree
In terms of doctorate degree, the demographic groups most similar to Kiowa are U.S. Virgin Islander (1.5%, a difference of 0.0%), Crow (1.5%, a difference of 0.090%), Salvadoran (1.5%, a difference of 0.12%), Immigrants from Trinidad and Tobago (1.5%, a difference of 0.19%), and Immigrants from Barbados (1.5%, a difference of 0.28%).
| Demographics | Rating | Rank | Doctorate Degree |
| Japanese | 0.9 /100 | #260 | Tragic 1.5% |
| Immigrants | Portugal | 0.8 /100 | #261 | Tragic 1.5% |
| Chickasaw | 0.7 /100 | #262 | Tragic 1.5% |
| Immigrants | Bahamas | 0.7 /100 | #263 | Tragic 1.5% |
| Blackfeet | 0.7 /100 | #264 | Tragic 1.5% |
| Nicaraguans | 0.6 /100 | #265 | Tragic 1.5% |
| Immigrants | Liberia | 0.5 /100 | #266 | Tragic 1.5% |
| Kiowa | 0.5 /100 | #267 | Tragic 1.5% |
| U.S. Virgin Islanders | 0.5 /100 | #268 | Tragic 1.5% |
| Crow | 0.5 /100 | #269 | Tragic 1.5% |
| Salvadorans | 0.5 /100 | #270 | Tragic 1.5% |
| Immigrants | Trinidad and Tobago | 0.5 /100 | #271 | Tragic 1.5% |
| Immigrants | Barbados | 0.4 /100 | #272 | Tragic 1.5% |
| Sioux | 0.4 /100 | #273 | Tragic 1.5% |
| Yaqui | 0.4 /100 | #274 | Tragic 1.5% |
Demographics Similar to Immigrants from Senegal by Doctorate Degree
In terms of doctorate degree, the demographic groups most similar to Immigrants from Senegal are Immigrants from Syria (1.9%, a difference of 0.25%), Kenyan (1.9%, a difference of 0.27%), Luxembourger (1.9%, a difference of 0.33%), Immigrants from Moldova (2.0%, a difference of 0.45%), and Sierra Leonean (2.0%, a difference of 0.66%).
| Demographics | Rating | Rank | Doctorate Degree |
| Immigrants | Africa | 87.0 /100 | #140 | Excellent 2.0% |
| Senegalese | 86.7 /100 | #141 | Excellent 2.0% |
| Italians | 86.0 /100 | #142 | Excellent 2.0% |
| Sierra Leoneans | 85.1 /100 | #143 | Excellent 2.0% |
| Immigrants | Moldova | 84.3 /100 | #144 | Excellent 2.0% |
| Kenyans | 83.6 /100 | #145 | Excellent 1.9% |
| Immigrants | Syria | 83.6 /100 | #146 | Excellent 1.9% |
| Immigrants | Senegal | 82.5 /100 | #147 | Excellent 1.9% |
| Luxembourgers | 81.1 /100 | #148 | Excellent 1.9% |
| Basques | 76.9 /100 | #149 | Good 1.9% |
| English | 75.9 /100 | #150 | Good 1.9% |
| Albanians | 74.8 /100 | #151 | Good 1.9% |
| Immigrants | Kenya | 74.3 /100 | #152 | Good 1.9% |
| Immigrants | Oceania | 74.0 /100 | #153 | Good 1.9% |
| Immigrants | Albania | 72.8 /100 | #154 | Good 1.9% |