Kiowa vs Ugandan In Labor Force | Age 20-24
COMPARE
Kiowa
Ugandan
In Labor Force | Age 20-24
In Labor Force | Age 20-24 Comparison
Kiowa
Ugandans
73.2%
IN LABOR FORCE | AGE 20-24
0.1/ 100
METRIC RATING
284th/ 347
METRIC RANK
75.4%
IN LABOR FORCE | AGE 20-24
76.1/ 100
METRIC RATING
149th/ 347
METRIC RANK
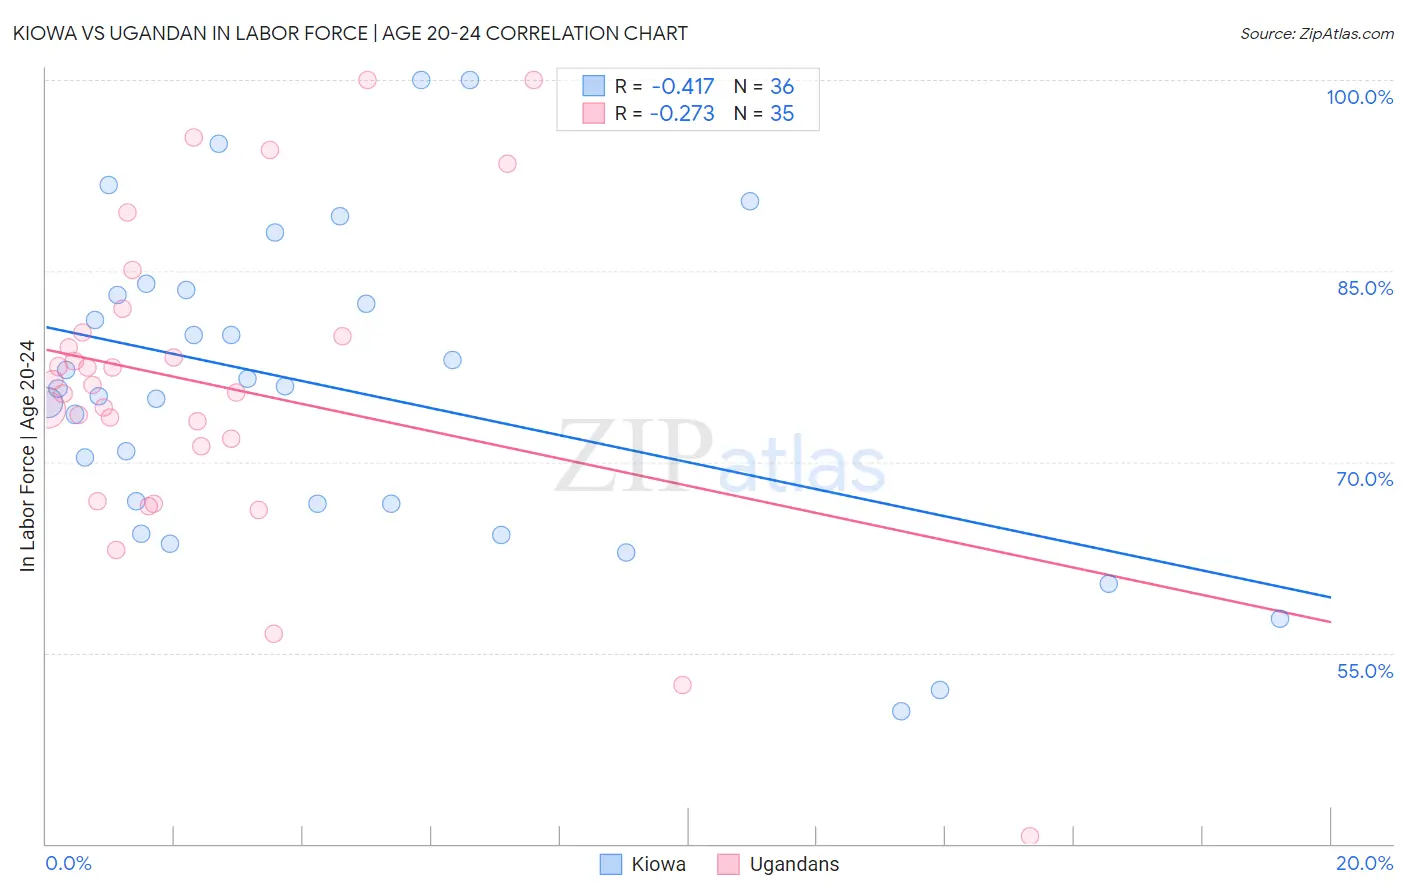
Kiowa vs Ugandan In Labor Force | Age 20-24 Correlation Chart
The statistical analysis conducted on geographies consisting of 56,096,922 people shows a moderate negative correlation between the proportion of Kiowa and labor force participation rate among population between the ages 20 and 24 in the United States with a correlation coefficient (R) of -0.417 and weighted average of 73.2%. Similarly, the statistical analysis conducted on geographies consisting of 94,014,885 people shows a weak negative correlation between the proportion of Ugandans and labor force participation rate among population between the ages 20 and 24 in the United States with a correlation coefficient (R) of -0.273 and weighted average of 75.4%, a difference of 2.9%.
In Labor Force | Age 20-24 Correlation Summary
| Measurement | Kiowa | Ugandan |
| Minimum | 50.4% | 40.6% |
| Maximum | 100.0% | 100.0% |
| Range | 49.6% | 59.4% |
| Mean | 75.8% | 76.1% |
| Median | 75.9% | 76.0% |
| Interquartile 25% (IQ1) | 66.7% | 71.2% |
| Interquartile 75% (IQ3) | 83.3% | 80.2% |
| Interquartile Range (IQR) | 16.6% | 8.9% |
| Standard Deviation (Sample) | 12.3% | 12.5% |
| Standard Deviation (Population) | 12.1% | 12.3% |
Similar Demographics by In Labor Force | Age 20-24
Demographics Similar to Kiowa by In Labor Force | Age 20-24
In terms of in labor force | age 20-24, the demographic groups most similar to Kiowa are Immigrants from Bahamas (73.2%, a difference of 0.020%), Immigrants from Spain (73.2%, a difference of 0.030%), Immigrants from Venezuela (73.2%, a difference of 0.040%), Nicaraguan (73.2%, a difference of 0.060%), and Bahamian (73.3%, a difference of 0.070%).
| Demographics | Rating | Rank | In Labor Force | Age 20-24 |
| Immigrants | Malaysia | 0.2 /100 | #277 | Tragic 73.3% |
| Cypriots | 0.2 /100 | #278 | Tragic 73.3% |
| Venezuelans | 0.2 /100 | #279 | Tragic 73.3% |
| Bahamians | 0.1 /100 | #280 | Tragic 73.3% |
| Immigrants | Venezuela | 0.1 /100 | #281 | Tragic 73.2% |
| Immigrants | Spain | 0.1 /100 | #282 | Tragic 73.2% |
| Immigrants | Bahamas | 0.1 /100 | #283 | Tragic 73.2% |
| Kiowa | 0.1 /100 | #284 | Tragic 73.2% |
| Nicaraguans | 0.1 /100 | #285 | Tragic 73.2% |
| Immigrants | Lebanon | 0.1 /100 | #286 | Tragic 73.1% |
| Immigrants | Korea | 0.1 /100 | #287 | Tragic 73.1% |
| Argentineans | 0.1 /100 | #288 | Tragic 73.1% |
| U.S. Virgin Islanders | 0.1 /100 | #289 | Tragic 73.0% |
| Immigrants | Belarus | 0.1 /100 | #290 | Tragic 73.0% |
| Immigrants | Nicaragua | 0.0 /100 | #291 | Tragic 72.9% |
Demographics Similar to Ugandans by In Labor Force | Age 20-24
In terms of in labor force | age 20-24, the demographic groups most similar to Ugandans are Immigrants from Cambodia (75.4%, a difference of 0.010%), Salvadoran (75.3%, a difference of 0.020%), Comanche (75.4%, a difference of 0.030%), Paiute (75.3%, a difference of 0.040%), and Lebanese (75.3%, a difference of 0.050%).
| Demographics | Rating | Rank | In Labor Force | Age 20-24 |
| Blackfeet | 83.6 /100 | #142 | Excellent 75.5% |
| Spaniards | 82.0 /100 | #143 | Excellent 75.5% |
| Bhutanese | 80.8 /100 | #144 | Excellent 75.4% |
| Koreans | 79.7 /100 | #145 | Good 75.4% |
| Mexican American Indians | 78.8 /100 | #146 | Good 75.4% |
| Comanche | 77.6 /100 | #147 | Good 75.4% |
| Immigrants | Cambodia | 76.7 /100 | #148 | Good 75.4% |
| Ugandans | 76.1 /100 | #149 | Good 75.4% |
| Salvadorans | 74.8 /100 | #150 | Good 75.3% |
| Paiute | 74.1 /100 | #151 | Good 75.3% |
| Lebanese | 73.5 /100 | #152 | Good 75.3% |
| Guatemalans | 72.3 /100 | #153 | Good 75.3% |
| Osage | 72.3 /100 | #154 | Good 75.3% |
| Immigrants | Guatemala | 71.9 /100 | #155 | Good 75.3% |
| Immigrants | El Salvador | 71.7 /100 | #156 | Good 75.3% |