Kiowa vs Immigrants from Zaire In Labor Force | Age 20-24
COMPARE
Kiowa
Immigrants from Zaire
In Labor Force | Age 20-24
In Labor Force | Age 20-24 Comparison
Kiowa
Immigrants from Zaire
73.2%
IN LABOR FORCE | AGE 20-24
0.1/ 100
METRIC RATING
284th/ 347
METRIC RANK
76.6%
IN LABOR FORCE | AGE 20-24
99.6/ 100
METRIC RATING
79th/ 347
METRIC RANK
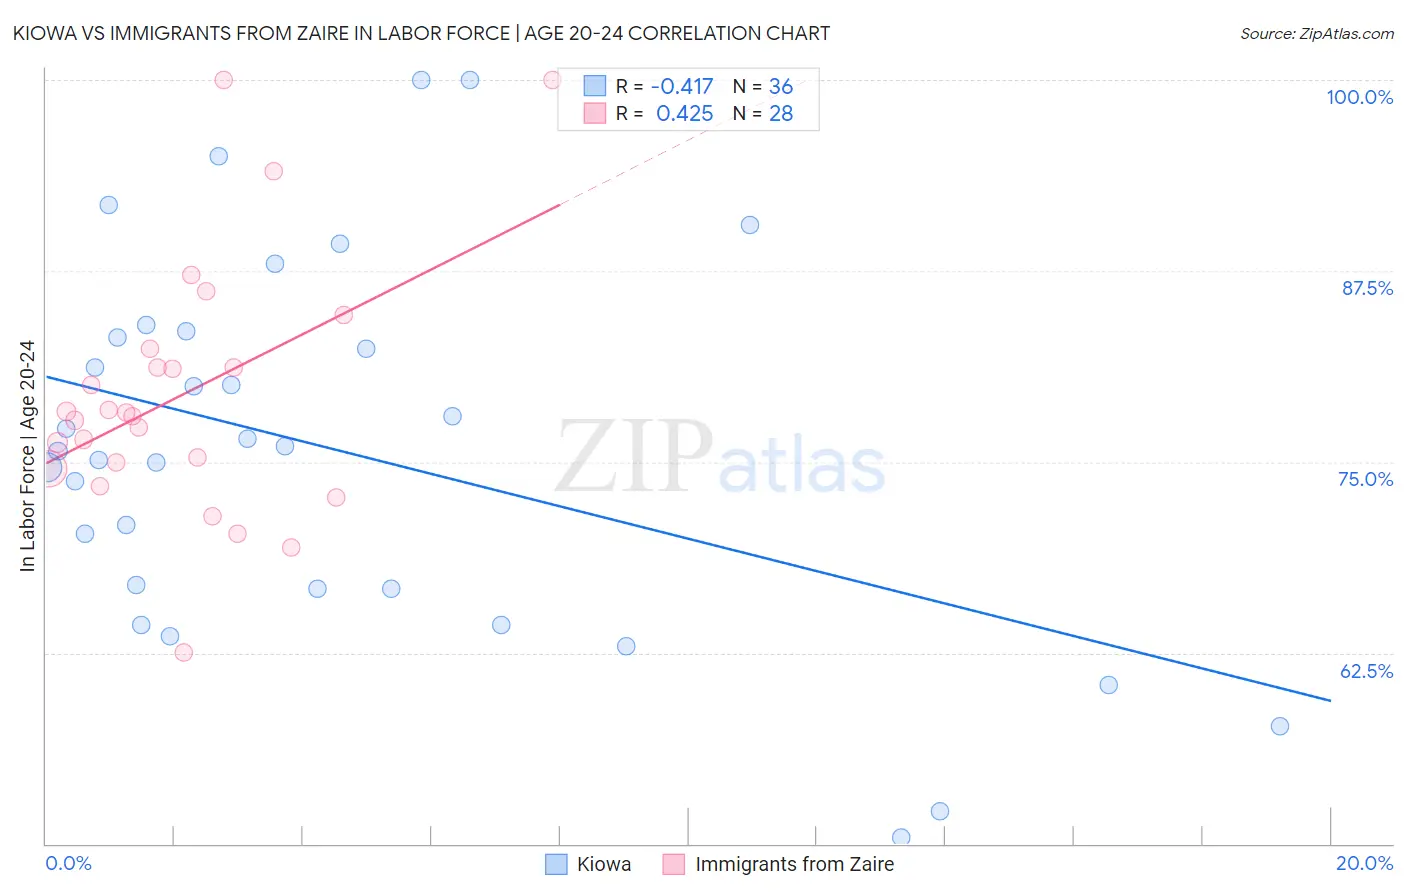
Kiowa vs Immigrants from Zaire In Labor Force | Age 20-24 Correlation Chart
The statistical analysis conducted on geographies consisting of 56,096,922 people shows a moderate negative correlation between the proportion of Kiowa and labor force participation rate among population between the ages 20 and 24 in the United States with a correlation coefficient (R) of -0.417 and weighted average of 73.2%. Similarly, the statistical analysis conducted on geographies consisting of 107,224,188 people shows a moderate positive correlation between the proportion of Immigrants from Zaire and labor force participation rate among population between the ages 20 and 24 in the United States with a correlation coefficient (R) of 0.425 and weighted average of 76.6%, a difference of 4.6%.
In Labor Force | Age 20-24 Correlation Summary
| Measurement | Kiowa | Immigrants from Zaire |
| Minimum | 50.4% | 62.5% |
| Maximum | 100.0% | 100.0% |
| Range | 49.6% | 37.5% |
| Mean | 75.8% | 79.4% |
| Median | 75.9% | 78.1% |
| Interquartile 25% (IQ1) | 66.7% | 74.7% |
| Interquartile 75% (IQ3) | 83.3% | 81.8% |
| Interquartile Range (IQR) | 16.6% | 7.1% |
| Standard Deviation (Sample) | 12.3% | 8.4% |
| Standard Deviation (Population) | 12.1% | 8.3% |
Similar Demographics by In Labor Force | Age 20-24
Demographics Similar to Kiowa by In Labor Force | Age 20-24
In terms of in labor force | age 20-24, the demographic groups most similar to Kiowa are Immigrants from Bahamas (73.2%, a difference of 0.020%), Immigrants from Spain (73.2%, a difference of 0.030%), Immigrants from Venezuela (73.2%, a difference of 0.040%), Nicaraguan (73.2%, a difference of 0.060%), and Bahamian (73.3%, a difference of 0.070%).
| Demographics | Rating | Rank | In Labor Force | Age 20-24 |
| Immigrants | Malaysia | 0.2 /100 | #277 | Tragic 73.3% |
| Cypriots | 0.2 /100 | #278 | Tragic 73.3% |
| Venezuelans | 0.2 /100 | #279 | Tragic 73.3% |
| Bahamians | 0.1 /100 | #280 | Tragic 73.3% |
| Immigrants | Venezuela | 0.1 /100 | #281 | Tragic 73.2% |
| Immigrants | Spain | 0.1 /100 | #282 | Tragic 73.2% |
| Immigrants | Bahamas | 0.1 /100 | #283 | Tragic 73.2% |
| Kiowa | 0.1 /100 | #284 | Tragic 73.2% |
| Nicaraguans | 0.1 /100 | #285 | Tragic 73.2% |
| Immigrants | Lebanon | 0.1 /100 | #286 | Tragic 73.1% |
| Immigrants | Korea | 0.1 /100 | #287 | Tragic 73.1% |
| Argentineans | 0.1 /100 | #288 | Tragic 73.1% |
| U.S. Virgin Islanders | 0.1 /100 | #289 | Tragic 73.0% |
| Immigrants | Belarus | 0.1 /100 | #290 | Tragic 73.0% |
| Immigrants | Nicaragua | 0.0 /100 | #291 | Tragic 72.9% |
Demographics Similar to Immigrants from Zaire by In Labor Force | Age 20-24
In terms of in labor force | age 20-24, the demographic groups most similar to Immigrants from Zaire are Immigrants from Cameroon (76.6%, a difference of 0.020%), Canadian (76.6%, a difference of 0.020%), Italian (76.5%, a difference of 0.030%), Basque (76.5%, a difference of 0.040%), and Hmong (76.5%, a difference of 0.040%).
| Demographics | Rating | Rank | In Labor Force | Age 20-24 |
| Guamanians/Chamorros | 99.8 /100 | #72 | Exceptional 76.7% |
| British | 99.8 /100 | #73 | Exceptional 76.7% |
| Cree | 99.7 /100 | #74 | Exceptional 76.6% |
| Immigrants | Middle Africa | 99.7 /100 | #75 | Exceptional 76.6% |
| Immigrants | Moldova | 99.6 /100 | #76 | Exceptional 76.6% |
| Immigrants | Cameroon | 99.6 /100 | #77 | Exceptional 76.6% |
| Canadians | 99.6 /100 | #78 | Exceptional 76.6% |
| Immigrants | Zaire | 99.6 /100 | #79 | Exceptional 76.6% |
| Italians | 99.6 /100 | #80 | Exceptional 76.5% |
| Basques | 99.5 /100 | #81 | Exceptional 76.5% |
| Hmong | 99.5 /100 | #82 | Exceptional 76.5% |
| Carpatho Rusyns | 99.4 /100 | #83 | Exceptional 76.5% |
| Austrians | 99.4 /100 | #84 | Exceptional 76.5% |
| Portuguese | 99.3 /100 | #85 | Exceptional 76.4% |
| Immigrants | Iraq | 99.3 /100 | #86 | Exceptional 76.4% |