Kiowa vs Navajo In Labor Force | Age 16-19
COMPARE
Kiowa
Navajo
In Labor Force | Age 16-19
In Labor Force | Age 16-19 Comparison
Kiowa
Navajo
37.2%
IN LABOR FORCE | AGE 16-19
80.4/ 100
METRIC RATING
156th/ 347
METRIC RANK
32.1%
IN LABOR FORCE | AGE 16-19
0.0/ 100
METRIC RATING
308th/ 347
METRIC RANK
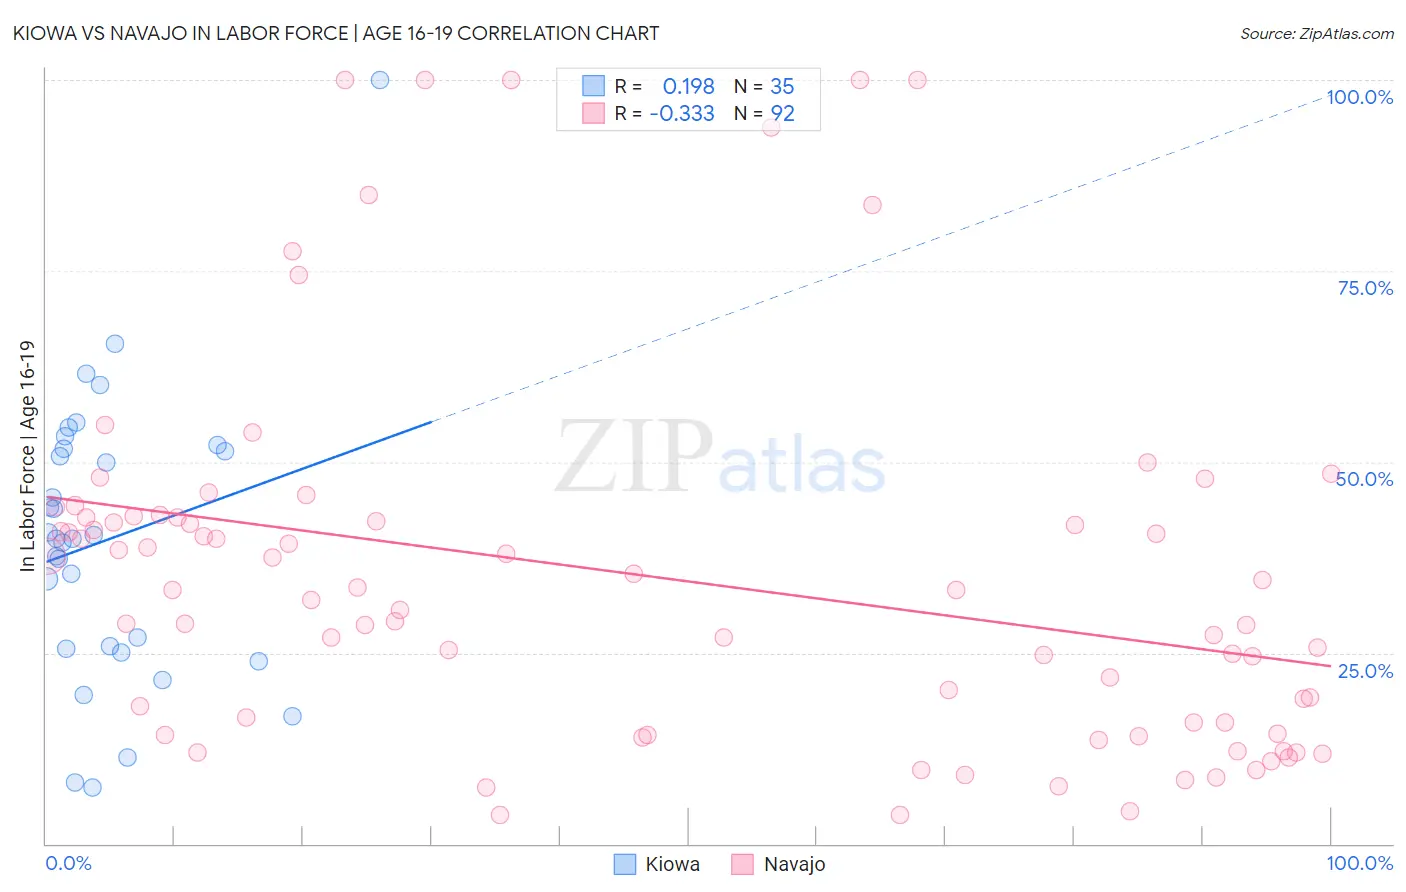
Kiowa vs Navajo In Labor Force | Age 16-19 Correlation Chart
The statistical analysis conducted on geographies consisting of 56,077,832 people shows a poor positive correlation between the proportion of Kiowa and labor force participation rate among population between the ages 16 and 19 in the United States with a correlation coefficient (R) of 0.198 and weighted average of 37.2%. Similarly, the statistical analysis conducted on geographies consisting of 224,572,215 people shows a mild negative correlation between the proportion of Navajo and labor force participation rate among population between the ages 16 and 19 in the United States with a correlation coefficient (R) of -0.333 and weighted average of 32.1%, a difference of 16.0%.
In Labor Force | Age 16-19 Correlation Summary
| Measurement | Kiowa | Navajo |
| Minimum | 7.4% | 3.8% |
| Maximum | 100.0% | 100.0% |
| Range | 92.6% | 96.2% |
| Mean | 39.9% | 35.0% |
| Median | 40.0% | 32.6% |
| Interquartile 25% (IQ1) | 25.5% | 15.1% |
| Interquartile 75% (IQ3) | 51.7% | 42.8% |
| Interquartile Range (IQR) | 26.2% | 27.6% |
| Standard Deviation (Sample) | 18.6% | 24.1% |
| Standard Deviation (Population) | 18.3% | 24.0% |
Similar Demographics by In Labor Force | Age 16-19
Demographics Similar to Kiowa by In Labor Force | Age 16-19
In terms of in labor force | age 16-19, the demographic groups most similar to Kiowa are Immigrants from Lithuania (37.2%, a difference of 0.020%), Immigrants from Bulgaria (37.3%, a difference of 0.10%), Arapaho (37.3%, a difference of 0.12%), Immigrants from Sierra Leone (37.3%, a difference of 0.27%), and Immigrants from Brazil (37.1%, a difference of 0.29%).
| Demographics | Rating | Rank | In Labor Force | Age 16-19 |
| Native Hawaiians | 85.0 /100 | #149 | Excellent 37.4% |
| Tsimshian | 84.7 /100 | #150 | Excellent 37.4% |
| Immigrants | Poland | 84.4 /100 | #151 | Excellent 37.3% |
| Immigrants | Sierra Leone | 83.6 /100 | #152 | Excellent 37.3% |
| Arapaho | 81.8 /100 | #153 | Excellent 37.3% |
| Immigrants | Bulgaria | 81.6 /100 | #154 | Excellent 37.3% |
| Immigrants | Lithuania | 80.7 /100 | #155 | Excellent 37.2% |
| Kiowa | 80.4 /100 | #156 | Excellent 37.2% |
| Immigrants | Brazil | 76.5 /100 | #157 | Good 37.1% |
| Ute | 75.7 /100 | #158 | Good 37.1% |
| Yaqui | 74.4 /100 | #159 | Good 37.1% |
| Immigrants | Saudi Arabia | 73.9 /100 | #160 | Good 37.0% |
| Cambodians | 71.5 /100 | #161 | Good 37.0% |
| Immigrants | Jordan | 69.5 /100 | #162 | Good 36.9% |
| Bermudans | 69.3 /100 | #163 | Good 36.9% |
Demographics Similar to Navajo by In Labor Force | Age 16-19
In terms of in labor force | age 16-19, the demographic groups most similar to Navajo are Immigrants from Eastern Asia (32.0%, a difference of 0.18%), Immigrants from Iran (32.0%, a difference of 0.32%), Immigrants from Jamaica (32.2%, a difference of 0.35%), Indian (Asian) (31.9%, a difference of 0.68%), and Immigrants from Belize (31.8%, a difference of 0.83%).
| Demographics | Rating | Rank | In Labor Force | Age 16-19 |
| Okinawans | 0.0 /100 | #301 | Tragic 32.8% |
| Belizeans | 0.0 /100 | #302 | Tragic 32.8% |
| Immigrants | Dominica | 0.0 /100 | #303 | Tragic 32.5% |
| Israelis | 0.0 /100 | #304 | Tragic 32.4% |
| Nicaraguans | 0.0 /100 | #305 | Tragic 32.4% |
| Spanish American Indians | 0.0 /100 | #306 | Tragic 32.4% |
| Immigrants | Jamaica | 0.0 /100 | #307 | Tragic 32.2% |
| Navajo | 0.0 /100 | #308 | Tragic 32.1% |
| Immigrants | Eastern Asia | 0.0 /100 | #309 | Tragic 32.0% |
| Immigrants | Iran | 0.0 /100 | #310 | Tragic 32.0% |
| Indians (Asian) | 0.0 /100 | #311 | Tragic 31.9% |
| Immigrants | Belize | 0.0 /100 | #312 | Tragic 31.8% |
| Hopi | 0.0 /100 | #313 | Tragic 31.8% |
| Cubans | 0.0 /100 | #314 | Tragic 31.8% |
| Immigrants | West Indies | 0.0 /100 | #315 | Tragic 31.7% |