Japanese vs Immigrants from West Indies In Labor Force | Age 35-44
COMPARE
Japanese
Immigrants from West Indies
In Labor Force | Age 35-44
In Labor Force | Age 35-44 Comparison
Japanese
Immigrants from West Indies
83.6%
IN LABOR FORCE | AGE 35-44
0.3/ 100
METRIC RATING
256th/ 347
METRIC RANK
84.3%
IN LABOR FORCE | AGE 35-44
36.4/ 100
METRIC RATING
181st/ 347
METRIC RANK
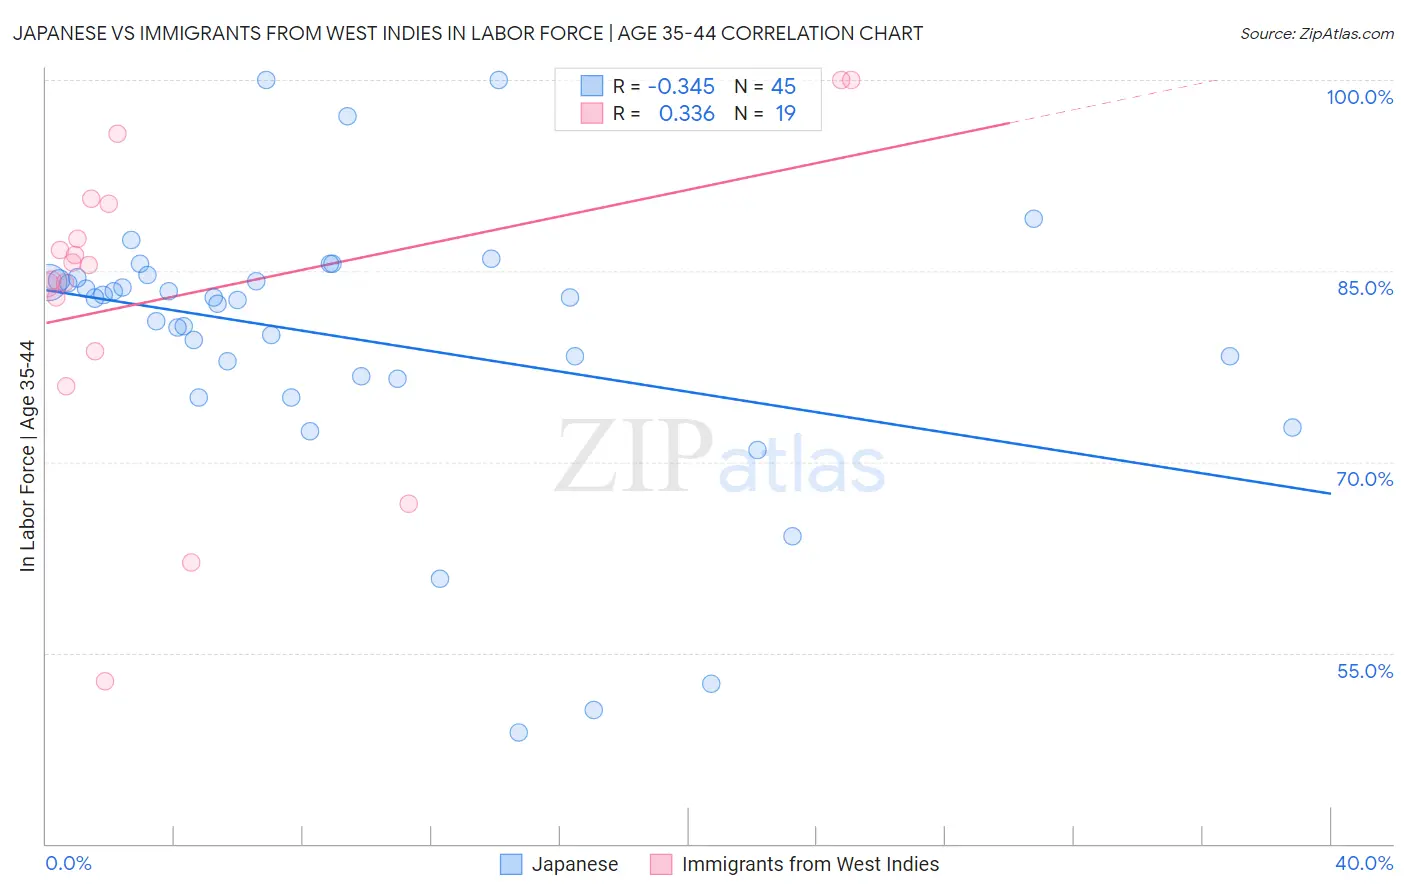
Japanese vs Immigrants from West Indies In Labor Force | Age 35-44 Correlation Chart
The statistical analysis conducted on geographies consisting of 249,106,093 people shows a mild negative correlation between the proportion of Japanese and labor force participation rate among population between the ages 35 and 44 in the United States with a correlation coefficient (R) of -0.345 and weighted average of 83.6%. Similarly, the statistical analysis conducted on geographies consisting of 72,456,461 people shows a mild positive correlation between the proportion of Immigrants from West Indies and labor force participation rate among population between the ages 35 and 44 in the United States with a correlation coefficient (R) of 0.336 and weighted average of 84.3%, a difference of 0.85%.
In Labor Force | Age 35-44 Correlation Summary
| Measurement | Japanese | Immigrants from West Indies |
| Minimum | 48.7% | 52.8% |
| Maximum | 100.0% | 100.0% |
| Range | 51.3% | 47.2% |
| Mean | 79.7% | 83.1% |
| Median | 82.9% | 85.4% |
| Interquartile 25% (IQ1) | 76.6% | 78.7% |
| Interquartile 75% (IQ3) | 84.4% | 90.3% |
| Interquartile Range (IQR) | 7.8% | 11.6% |
| Standard Deviation (Sample) | 10.7% | 12.0% |
| Standard Deviation (Population) | 10.6% | 11.7% |
Similar Demographics by In Labor Force | Age 35-44
Demographics Similar to Japanese by In Labor Force | Age 35-44
In terms of in labor force | age 35-44, the demographic groups most similar to Japanese are Immigrants from the Azores (83.6%, a difference of 0.020%), Basque (83.6%, a difference of 0.020%), Tongan (83.6%, a difference of 0.040%), Tsimshian (83.5%, a difference of 0.040%), and Salvadoran (83.6%, a difference of 0.060%).
| Demographics | Rating | Rank | In Labor Force | Age 35-44 |
| Immigrants | St. Vincent and the Grenadines | 0.7 /100 | #249 | Tragic 83.7% |
| Whites/Caucasians | 0.5 /100 | #250 | Tragic 83.6% |
| Salvadorans | 0.4 /100 | #251 | Tragic 83.6% |
| Immigrants | Guyana | 0.4 /100 | #252 | Tragic 83.6% |
| Lebanese | 0.4 /100 | #253 | Tragic 83.6% |
| Tongans | 0.4 /100 | #254 | Tragic 83.6% |
| Immigrants | Azores | 0.3 /100 | #255 | Tragic 83.6% |
| Japanese | 0.3 /100 | #256 | Tragic 83.6% |
| Basques | 0.3 /100 | #257 | Tragic 83.6% |
| Tsimshian | 0.2 /100 | #258 | Tragic 83.5% |
| Immigrants | El Salvador | 0.2 /100 | #259 | Tragic 83.5% |
| Vietnamese | 0.2 /100 | #260 | Tragic 83.5% |
| Immigrants | Dominica | 0.2 /100 | #261 | Tragic 83.5% |
| Immigrants | Congo | 0.2 /100 | #262 | Tragic 83.5% |
| Iroquois | 0.2 /100 | #263 | Tragic 83.5% |
Demographics Similar to Immigrants from West Indies by In Labor Force | Age 35-44
In terms of in labor force | age 35-44, the demographic groups most similar to Immigrants from West Indies are Korean (84.3%, a difference of 0.0%), Barbadian (84.3%, a difference of 0.0%), Armenian (84.3%, a difference of 0.010%), Costa Rican (84.3%, a difference of 0.010%), and Australian (84.3%, a difference of 0.010%).
| Demographics | Rating | Rank | In Labor Force | Age 35-44 |
| Immigrants | Iran | 50.0 /100 | #174 | Average 84.4% |
| Pakistanis | 48.2 /100 | #175 | Average 84.4% |
| Sri Lankans | 47.3 /100 | #176 | Average 84.4% |
| French Canadians | 44.3 /100 | #177 | Average 84.3% |
| Northern Europeans | 44.1 /100 | #178 | Average 84.3% |
| Immigrants | South Africa | 42.8 /100 | #179 | Average 84.3% |
| Danes | 38.8 /100 | #180 | Fair 84.3% |
| Immigrants | West Indies | 36.4 /100 | #181 | Fair 84.3% |
| Koreans | 36.3 /100 | #182 | Fair 84.3% |
| Barbadians | 36.2 /100 | #183 | Fair 84.3% |
| Armenians | 35.6 /100 | #184 | Fair 84.3% |
| Costa Ricans | 35.3 /100 | #185 | Fair 84.3% |
| Australians | 35.1 /100 | #186 | Fair 84.3% |
| Dutch | 34.8 /100 | #187 | Fair 84.3% |
| South Africans | 34.1 /100 | #188 | Fair 84.3% |