Japanese vs Sioux In Labor Force | Age 35-44
COMPARE
Japanese
Sioux
In Labor Force | Age 35-44
In Labor Force | Age 35-44 Comparison
Japanese
Sioux
83.6%
IN LABOR FORCE | AGE 35-44
0.3/ 100
METRIC RATING
256th/ 347
METRIC RANK
80.2%
IN LABOR FORCE | AGE 35-44
0.0/ 100
METRIC RATING
327th/ 347
METRIC RANK
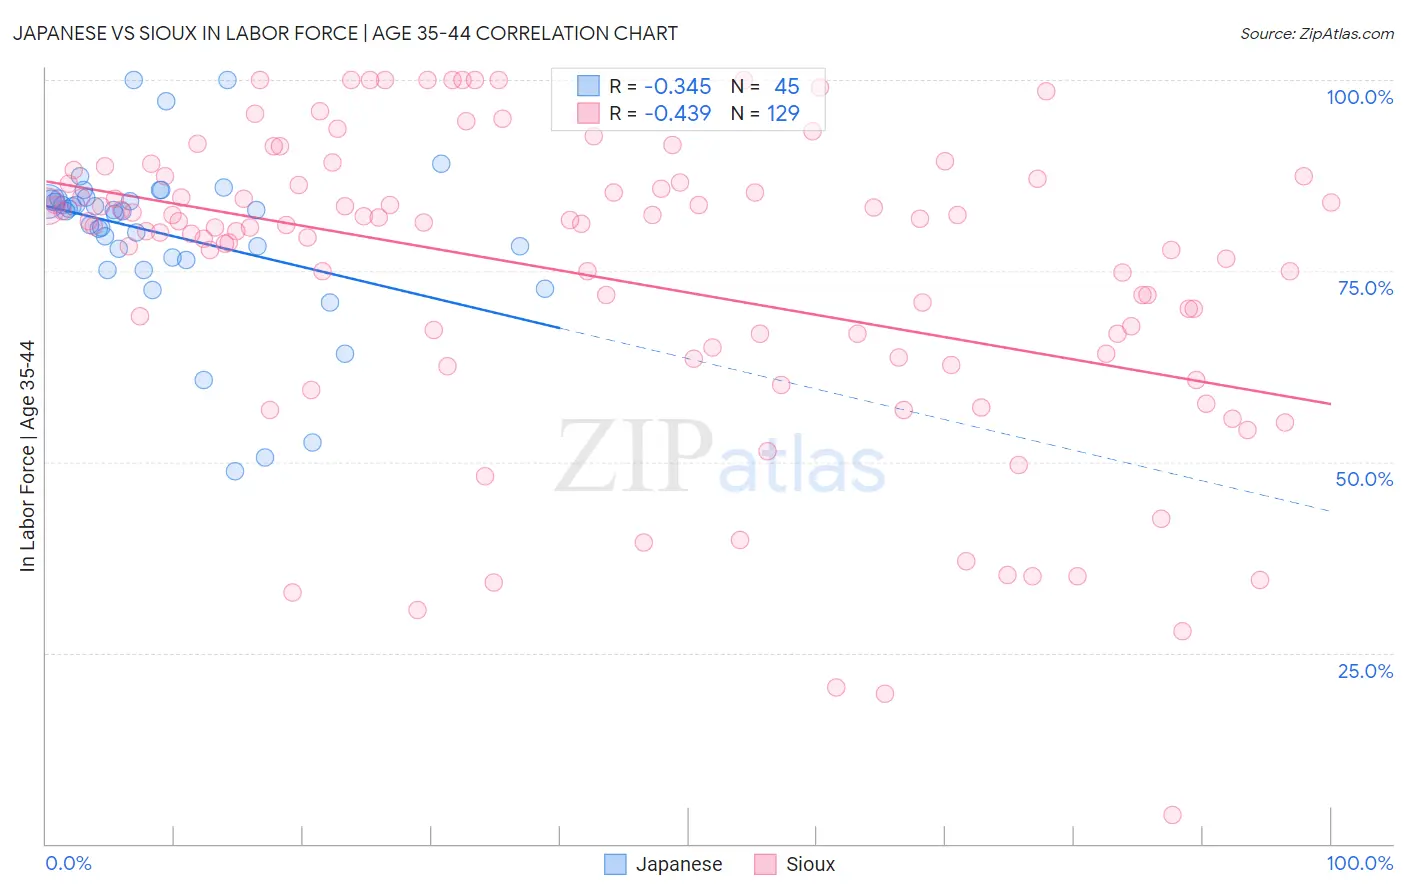
Japanese vs Sioux In Labor Force | Age 35-44 Correlation Chart
The statistical analysis conducted on geographies consisting of 249,106,093 people shows a mild negative correlation between the proportion of Japanese and labor force participation rate among population between the ages 35 and 44 in the United States with a correlation coefficient (R) of -0.345 and weighted average of 83.6%. Similarly, the statistical analysis conducted on geographies consisting of 234,125,659 people shows a moderate negative correlation between the proportion of Sioux and labor force participation rate among population between the ages 35 and 44 in the United States with a correlation coefficient (R) of -0.439 and weighted average of 80.2%, a difference of 4.2%.
In Labor Force | Age 35-44 Correlation Summary
| Measurement | Japanese | Sioux |
| Minimum | 48.7% | 3.8% |
| Maximum | 100.0% | 100.0% |
| Range | 51.3% | 96.2% |
| Mean | 79.7% | 74.2% |
| Median | 82.9% | 80.8% |
| Interquartile 25% (IQ1) | 76.6% | 63.9% |
| Interquartile 75% (IQ3) | 84.4% | 86.5% |
| Interquartile Range (IQR) | 7.8% | 22.6% |
| Standard Deviation (Sample) | 10.7% | 20.1% |
| Standard Deviation (Population) | 10.6% | 20.0% |
Similar Demographics by In Labor Force | Age 35-44
Demographics Similar to Japanese by In Labor Force | Age 35-44
In terms of in labor force | age 35-44, the demographic groups most similar to Japanese are Immigrants from the Azores (83.6%, a difference of 0.020%), Basque (83.6%, a difference of 0.020%), Tongan (83.6%, a difference of 0.040%), Tsimshian (83.5%, a difference of 0.040%), and Salvadoran (83.6%, a difference of 0.060%).
| Demographics | Rating | Rank | In Labor Force | Age 35-44 |
| Immigrants | St. Vincent and the Grenadines | 0.7 /100 | #249 | Tragic 83.7% |
| Whites/Caucasians | 0.5 /100 | #250 | Tragic 83.6% |
| Salvadorans | 0.4 /100 | #251 | Tragic 83.6% |
| Immigrants | Guyana | 0.4 /100 | #252 | Tragic 83.6% |
| Lebanese | 0.4 /100 | #253 | Tragic 83.6% |
| Tongans | 0.4 /100 | #254 | Tragic 83.6% |
| Immigrants | Azores | 0.3 /100 | #255 | Tragic 83.6% |
| Japanese | 0.3 /100 | #256 | Tragic 83.6% |
| Basques | 0.3 /100 | #257 | Tragic 83.6% |
| Tsimshian | 0.2 /100 | #258 | Tragic 83.5% |
| Immigrants | El Salvador | 0.2 /100 | #259 | Tragic 83.5% |
| Vietnamese | 0.2 /100 | #260 | Tragic 83.5% |
| Immigrants | Dominica | 0.2 /100 | #261 | Tragic 83.5% |
| Immigrants | Congo | 0.2 /100 | #262 | Tragic 83.5% |
| Iroquois | 0.2 /100 | #263 | Tragic 83.5% |
Demographics Similar to Sioux by In Labor Force | Age 35-44
In terms of in labor force | age 35-44, the demographic groups most similar to Sioux are Seminole (80.4%, a difference of 0.17%), Dutch West Indian (80.4%, a difference of 0.21%), Creek (80.0%, a difference of 0.29%), Choctaw (80.5%, a difference of 0.36%), and Yaqui (80.5%, a difference of 0.37%).
| Demographics | Rating | Rank | In Labor Force | Age 35-44 |
| Chickasaw | 0.0 /100 | #320 | Tragic 80.9% |
| Puerto Ricans | 0.0 /100 | #321 | Tragic 80.7% |
| Paiute | 0.0 /100 | #322 | Tragic 80.6% |
| Yaqui | 0.0 /100 | #323 | Tragic 80.5% |
| Choctaw | 0.0 /100 | #324 | Tragic 80.5% |
| Dutch West Indians | 0.0 /100 | #325 | Tragic 80.4% |
| Seminole | 0.0 /100 | #326 | Tragic 80.4% |
| Sioux | 0.0 /100 | #327 | Tragic 80.2% |
| Creek | 0.0 /100 | #328 | Tragic 80.0% |
| Menominee | 0.0 /100 | #329 | Tragic 79.7% |
| Cheyenne | 0.0 /100 | #330 | Tragic 79.5% |
| Houma | 0.0 /100 | #331 | Tragic 79.5% |
| Ute | 0.0 /100 | #332 | Tragic 79.4% |
| Kiowa | 0.0 /100 | #333 | Tragic 79.2% |
| Yakama | 0.0 /100 | #334 | Tragic 79.0% |