Japanese vs Scottish In Labor Force | Age 35-44
COMPARE
Japanese
Scottish
In Labor Force | Age 35-44
In Labor Force | Age 35-44 Comparison
Japanese
Scottish
83.6%
IN LABOR FORCE | AGE 35-44
0.3/ 100
METRIC RATING
256th/ 347
METRIC RANK
83.9%
IN LABOR FORCE | AGE 35-44
3.2/ 100
METRIC RATING
231st/ 347
METRIC RANK
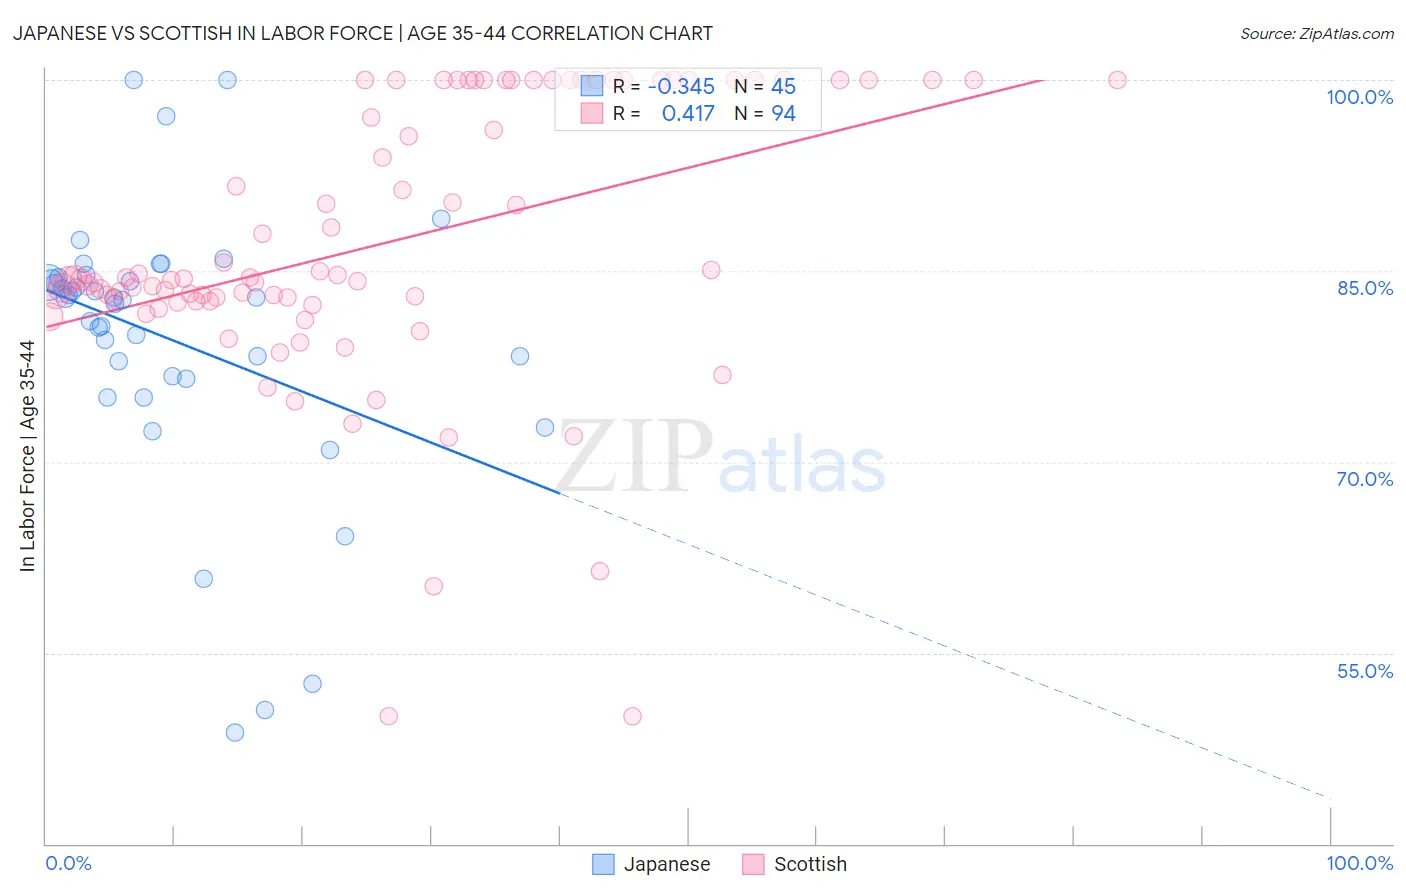
Japanese vs Scottish In Labor Force | Age 35-44 Correlation Chart
The statistical analysis conducted on geographies consisting of 249,106,093 people shows a mild negative correlation between the proportion of Japanese and labor force participation rate among population between the ages 35 and 44 in the United States with a correlation coefficient (R) of -0.345 and weighted average of 83.6%. Similarly, the statistical analysis conducted on geographies consisting of 566,464,566 people shows a moderate positive correlation between the proportion of Scottish and labor force participation rate among population between the ages 35 and 44 in the United States with a correlation coefficient (R) of 0.417 and weighted average of 83.9%, a difference of 0.38%.
In Labor Force | Age 35-44 Correlation Summary
| Measurement | Japanese | Scottish |
| Minimum | 48.7% | 50.0% |
| Maximum | 100.0% | 100.0% |
| Range | 51.3% | 50.0% |
| Mean | 79.7% | 87.1% |
| Median | 82.9% | 84.4% |
| Interquartile 25% (IQ1) | 76.6% | 82.6% |
| Interquartile 75% (IQ3) | 84.4% | 100.0% |
| Interquartile Range (IQR) | 7.8% | 17.4% |
| Standard Deviation (Sample) | 10.7% | 10.9% |
| Standard Deviation (Population) | 10.6% | 10.8% |
Similar Demographics by In Labor Force | Age 35-44
Demographics Similar to Japanese by In Labor Force | Age 35-44
In terms of in labor force | age 35-44, the demographic groups most similar to Japanese are Immigrants from the Azores (83.6%, a difference of 0.020%), Basque (83.6%, a difference of 0.020%), Tongan (83.6%, a difference of 0.040%), Tsimshian (83.5%, a difference of 0.040%), and Salvadoran (83.6%, a difference of 0.060%).
| Demographics | Rating | Rank | In Labor Force | Age 35-44 |
| Immigrants | St. Vincent and the Grenadines | 0.7 /100 | #249 | Tragic 83.7% |
| Whites/Caucasians | 0.5 /100 | #250 | Tragic 83.6% |
| Salvadorans | 0.4 /100 | #251 | Tragic 83.6% |
| Immigrants | Guyana | 0.4 /100 | #252 | Tragic 83.6% |
| Lebanese | 0.4 /100 | #253 | Tragic 83.6% |
| Tongans | 0.4 /100 | #254 | Tragic 83.6% |
| Immigrants | Azores | 0.3 /100 | #255 | Tragic 83.6% |
| Japanese | 0.3 /100 | #256 | Tragic 83.6% |
| Basques | 0.3 /100 | #257 | Tragic 83.6% |
| Tsimshian | 0.2 /100 | #258 | Tragic 83.5% |
| Immigrants | El Salvador | 0.2 /100 | #259 | Tragic 83.5% |
| Vietnamese | 0.2 /100 | #260 | Tragic 83.5% |
| Immigrants | Dominica | 0.2 /100 | #261 | Tragic 83.5% |
| Immigrants | Congo | 0.2 /100 | #262 | Tragic 83.5% |
| Iroquois | 0.2 /100 | #263 | Tragic 83.5% |
Demographics Similar to Scottish by In Labor Force | Age 35-44
In terms of in labor force | age 35-44, the demographic groups most similar to Scottish are Native Hawaiian (83.9%, a difference of 0.010%), Immigrants from Germany (83.9%, a difference of 0.020%), Immigrants from Iraq (83.9%, a difference of 0.030%), Immigrants from Oceania (83.9%, a difference of 0.030%), and Immigrants from Syria (83.9%, a difference of 0.040%).
| Demographics | Rating | Rank | In Labor Force | Age 35-44 |
| U.S. Virgin Islanders | 6.1 /100 | #224 | Tragic 84.0% |
| Immigrants | Burma/Myanmar | 6.1 /100 | #225 | Tragic 84.0% |
| Panamanians | 5.4 /100 | #226 | Tragic 84.0% |
| British West Indians | 5.3 /100 | #227 | Tragic 84.0% |
| Welsh | 5.3 /100 | #228 | Tragic 84.0% |
| Immigrants | Thailand | 4.7 /100 | #229 | Tragic 84.0% |
| Immigrants | Iraq | 3.7 /100 | #230 | Tragic 83.9% |
| Scottish | 3.2 /100 | #231 | Tragic 83.9% |
| Native Hawaiians | 3.0 /100 | #232 | Tragic 83.9% |
| Immigrants | Germany | 2.8 /100 | #233 | Tragic 83.9% |
| Immigrants | Oceania | 2.6 /100 | #234 | Tragic 83.9% |
| Immigrants | Syria | 2.5 /100 | #235 | Tragic 83.9% |
| West Indians | 2.4 /100 | #236 | Tragic 83.9% |
| English | 1.8 /100 | #237 | Tragic 83.8% |
| Immigrants | Laos | 1.7 /100 | #238 | Tragic 83.8% |