Peruvian vs Immigrants from West Indies In Labor Force | Age 35-44
COMPARE
Peruvian
Immigrants from West Indies
In Labor Force | Age 35-44
In Labor Force | Age 35-44 Comparison
Peruvians
Immigrants from West Indies
84.9%
IN LABOR FORCE | AGE 35-44
98.3/ 100
METRIC RATING
79th/ 347
METRIC RANK
84.3%
IN LABOR FORCE | AGE 35-44
36.4/ 100
METRIC RATING
181st/ 347
METRIC RANK
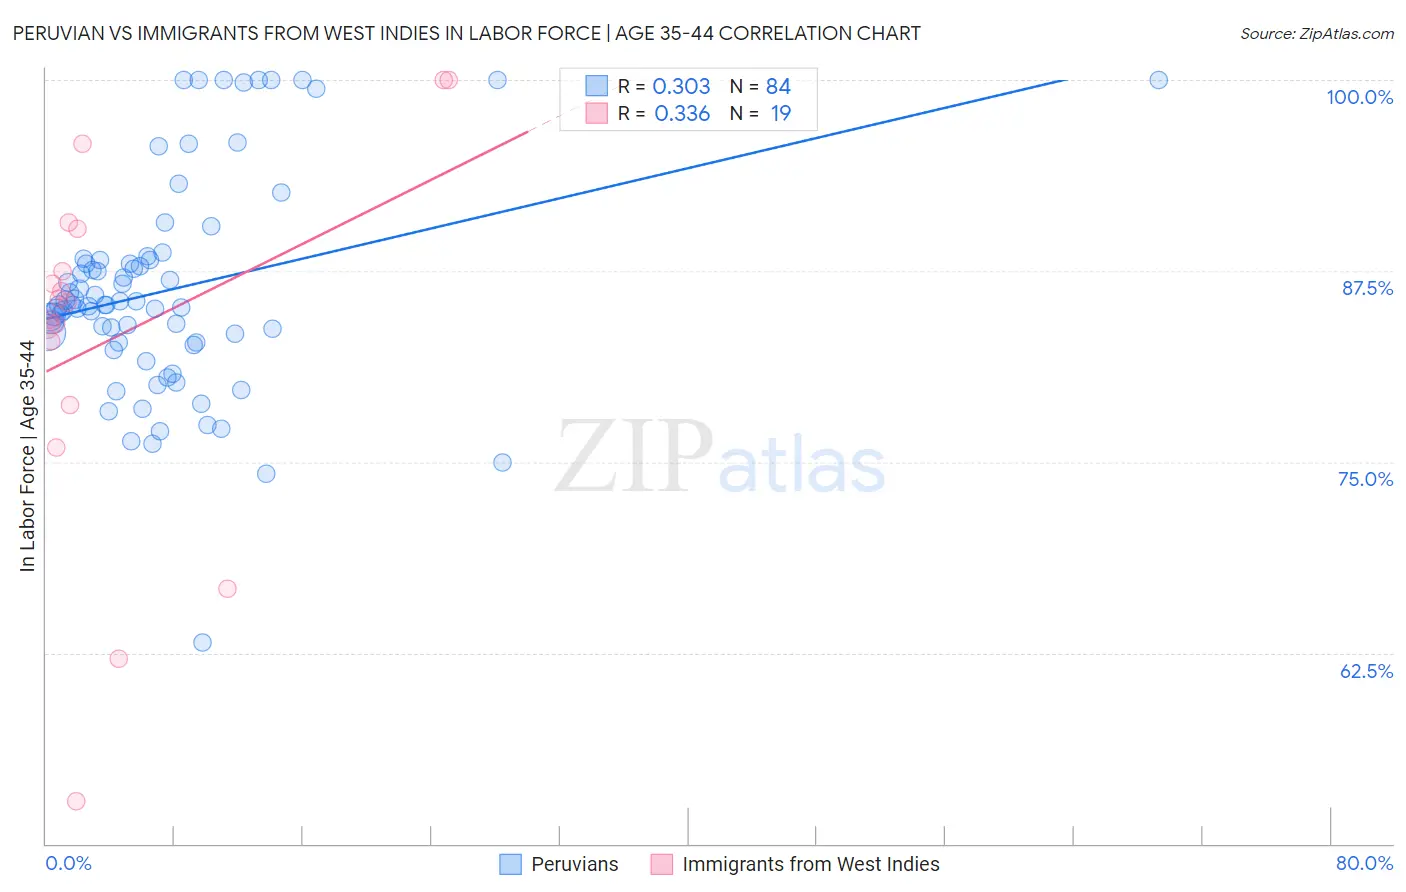
Peruvian vs Immigrants from West Indies In Labor Force | Age 35-44 Correlation Chart
The statistical analysis conducted on geographies consisting of 363,043,294 people shows a mild positive correlation between the proportion of Peruvians and labor force participation rate among population between the ages 35 and 44 in the United States with a correlation coefficient (R) of 0.303 and weighted average of 84.9%. Similarly, the statistical analysis conducted on geographies consisting of 72,456,461 people shows a mild positive correlation between the proportion of Immigrants from West Indies and labor force participation rate among population between the ages 35 and 44 in the United States with a correlation coefficient (R) of 0.336 and weighted average of 84.3%, a difference of 0.75%.
In Labor Force | Age 35-44 Correlation Summary
| Measurement | Peruvian | Immigrants from West Indies |
| Minimum | 63.1% | 52.8% |
| Maximum | 100.0% | 100.0% |
| Range | 36.9% | 47.2% |
| Mean | 86.2% | 83.1% |
| Median | 85.3% | 85.4% |
| Interquartile 25% (IQ1) | 82.8% | 78.7% |
| Interquartile 75% (IQ3) | 88.2% | 90.3% |
| Interquartile Range (IQR) | 5.4% | 11.6% |
| Standard Deviation (Sample) | 7.0% | 12.0% |
| Standard Deviation (Population) | 7.0% | 11.7% |
Similar Demographics by In Labor Force | Age 35-44
Demographics Similar to Peruvians by In Labor Force | Age 35-44
In terms of in labor force | age 35-44, the demographic groups most similar to Peruvians are Immigrants from Africa (84.9%, a difference of 0.0%), Immigrants from Colombia (84.9%, a difference of 0.0%), Immigrants from Eastern Europe (84.9%, a difference of 0.0%), Immigrants from Sudan (84.9%, a difference of 0.020%), and Immigrants from Cuba (84.9%, a difference of 0.030%).
| Demographics | Rating | Rank | In Labor Force | Age 35-44 |
| Immigrants | Singapore | 98.9 /100 | #72 | Exceptional 85.0% |
| Immigrants | Sri Lanka | 98.9 /100 | #73 | Exceptional 85.0% |
| Colombians | 98.8 /100 | #74 | Exceptional 85.0% |
| Immigrants | South Central Asia | 98.7 /100 | #75 | Exceptional 85.0% |
| Immigrants | Cuba | 98.6 /100 | #76 | Exceptional 84.9% |
| Immigrants | Turkey | 98.6 /100 | #77 | Exceptional 84.9% |
| Immigrants | Africa | 98.4 /100 | #78 | Exceptional 84.9% |
| Peruvians | 98.3 /100 | #79 | Exceptional 84.9% |
| Immigrants | Colombia | 98.3 /100 | #80 | Exceptional 84.9% |
| Immigrants | Eastern Europe | 98.3 /100 | #81 | Exceptional 84.9% |
| Immigrants | Sudan | 98.1 /100 | #82 | Exceptional 84.9% |
| Senegalese | 97.8 /100 | #83 | Exceptional 84.9% |
| Immigrants | Peru | 97.8 /100 | #84 | Exceptional 84.9% |
| Immigrants | Middle Africa | 97.8 /100 | #85 | Exceptional 84.9% |
| Greeks | 97.8 /100 | #86 | Exceptional 84.9% |
Demographics Similar to Immigrants from West Indies by In Labor Force | Age 35-44
In terms of in labor force | age 35-44, the demographic groups most similar to Immigrants from West Indies are Korean (84.3%, a difference of 0.0%), Barbadian (84.3%, a difference of 0.0%), Armenian (84.3%, a difference of 0.010%), Costa Rican (84.3%, a difference of 0.010%), and Australian (84.3%, a difference of 0.010%).
| Demographics | Rating | Rank | In Labor Force | Age 35-44 |
| Immigrants | Iran | 50.0 /100 | #174 | Average 84.4% |
| Pakistanis | 48.2 /100 | #175 | Average 84.4% |
| Sri Lankans | 47.3 /100 | #176 | Average 84.4% |
| French Canadians | 44.3 /100 | #177 | Average 84.3% |
| Northern Europeans | 44.1 /100 | #178 | Average 84.3% |
| Immigrants | South Africa | 42.8 /100 | #179 | Average 84.3% |
| Danes | 38.8 /100 | #180 | Fair 84.3% |
| Immigrants | West Indies | 36.4 /100 | #181 | Fair 84.3% |
| Koreans | 36.3 /100 | #182 | Fair 84.3% |
| Barbadians | 36.2 /100 | #183 | Fair 84.3% |
| Armenians | 35.6 /100 | #184 | Fair 84.3% |
| Costa Ricans | 35.3 /100 | #185 | Fair 84.3% |
| Australians | 35.1 /100 | #186 | Fair 84.3% |
| Dutch | 34.8 /100 | #187 | Fair 84.3% |
| South Africans | 34.1 /100 | #188 | Fair 84.3% |