Aleut vs Immigrants from West Indies In Labor Force | Age 35-44
COMPARE
Aleut
Immigrants from West Indies
In Labor Force | Age 35-44
In Labor Force | Age 35-44 Comparison
Aleuts
Immigrants from West Indies
84.4%
IN LABOR FORCE | AGE 35-44
59.1/ 100
METRIC RATING
163rd/ 347
METRIC RANK
84.3%
IN LABOR FORCE | AGE 35-44
36.4/ 100
METRIC RATING
181st/ 347
METRIC RANK
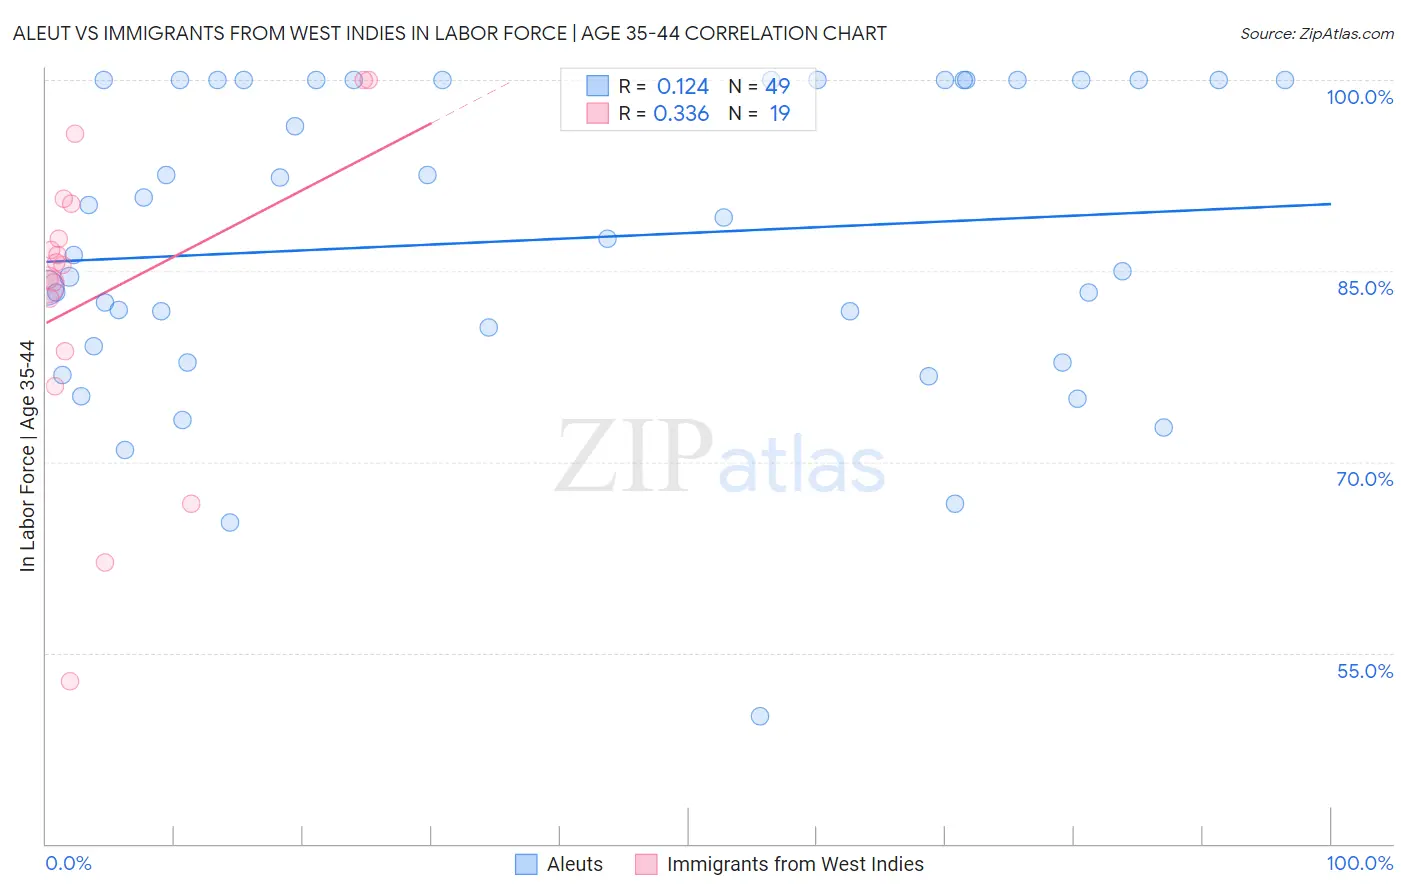
Aleut vs Immigrants from West Indies In Labor Force | Age 35-44 Correlation Chart
The statistical analysis conducted on geographies consisting of 61,775,675 people shows a poor positive correlation between the proportion of Aleuts and labor force participation rate among population between the ages 35 and 44 in the United States with a correlation coefficient (R) of 0.124 and weighted average of 84.4%. Similarly, the statistical analysis conducted on geographies consisting of 72,456,461 people shows a mild positive correlation between the proportion of Immigrants from West Indies and labor force participation rate among population between the ages 35 and 44 in the United States with a correlation coefficient (R) of 0.336 and weighted average of 84.3%, a difference of 0.15%.
In Labor Force | Age 35-44 Correlation Summary
| Measurement | Aleut | Immigrants from West Indies |
| Minimum | 50.0% | 52.8% |
| Maximum | 100.0% | 100.0% |
| Range | 50.0% | 47.2% |
| Mean | 87.4% | 83.1% |
| Median | 87.5% | 85.4% |
| Interquartile 25% (IQ1) | 78.4% | 78.7% |
| Interquartile 75% (IQ3) | 100.0% | 90.3% |
| Interquartile Range (IQR) | 21.6% | 11.6% |
| Standard Deviation (Sample) | 12.0% | 12.0% |
| Standard Deviation (Population) | 11.9% | 11.7% |
Demographics Similar to Aleuts and Immigrants from West Indies by In Labor Force | Age 35-44
In terms of in labor force | age 35-44, the demographic groups most similar to Aleuts are Immigrants from Hungary (84.4%, a difference of 0.0%), Nigerian (84.4%, a difference of 0.0%), Venezuelan (84.4%, a difference of 0.010%), Alsatian (84.4%, a difference of 0.030%), and Immigrants from Portugal (84.4%, a difference of 0.030%). Similarly, the demographic groups most similar to Immigrants from West Indies are Korean (84.3%, a difference of 0.0%), Danish (84.3%, a difference of 0.020%), Immigrants from South Africa (84.3%, a difference of 0.040%), French Canadian (84.3%, a difference of 0.050%), and Northern European (84.3%, a difference of 0.050%).
| Demographics | Rating | Rank | In Labor Force | Age 35-44 |
| Immigrants | Hungary | 59.4 /100 | #162 | Average 84.4% |
| Aleuts | 59.1 /100 | #163 | Average 84.4% |
| Nigerians | 58.9 /100 | #164 | Average 84.4% |
| Venezuelans | 58.1 /100 | #165 | Average 84.4% |
| Alsatians | 55.2 /100 | #166 | Average 84.4% |
| Immigrants | Portugal | 55.2 /100 | #167 | Average 84.4% |
| Irish | 53.1 /100 | #168 | Average 84.4% |
| Immigrants | Afghanistan | 52.7 /100 | #169 | Average 84.4% |
| Immigrants | Jordan | 52.5 /100 | #170 | Average 84.4% |
| Jordanians | 51.7 /100 | #171 | Average 84.4% |
| Scandinavians | 51.2 /100 | #172 | Average 84.4% |
| Immigrants | Trinidad and Tobago | 50.7 /100 | #173 | Average 84.4% |
| Immigrants | Iran | 50.0 /100 | #174 | Average 84.4% |
| Pakistanis | 48.2 /100 | #175 | Average 84.4% |
| Sri Lankans | 47.3 /100 | #176 | Average 84.4% |
| French Canadians | 44.3 /100 | #177 | Average 84.3% |
| Northern Europeans | 44.1 /100 | #178 | Average 84.3% |
| Immigrants | South Africa | 42.8 /100 | #179 | Average 84.3% |
| Danes | 38.8 /100 | #180 | Fair 84.3% |
| Immigrants | West Indies | 36.4 /100 | #181 | Fair 84.3% |
| Koreans | 36.3 /100 | #182 | Fair 84.3% |