Japanese vs Immigrants from West Indies Nursery School
COMPARE
Japanese
Immigrants from West Indies
Nursery School
Nursery School Comparison
Japanese
Immigrants from West Indies
96.7%
NURSERY SCHOOL
0.0/ 100
METRIC RATING
330th/ 347
METRIC RANK
97.4%
NURSERY SCHOOL
0.0/ 100
METRIC RATING
283rd/ 347
METRIC RANK
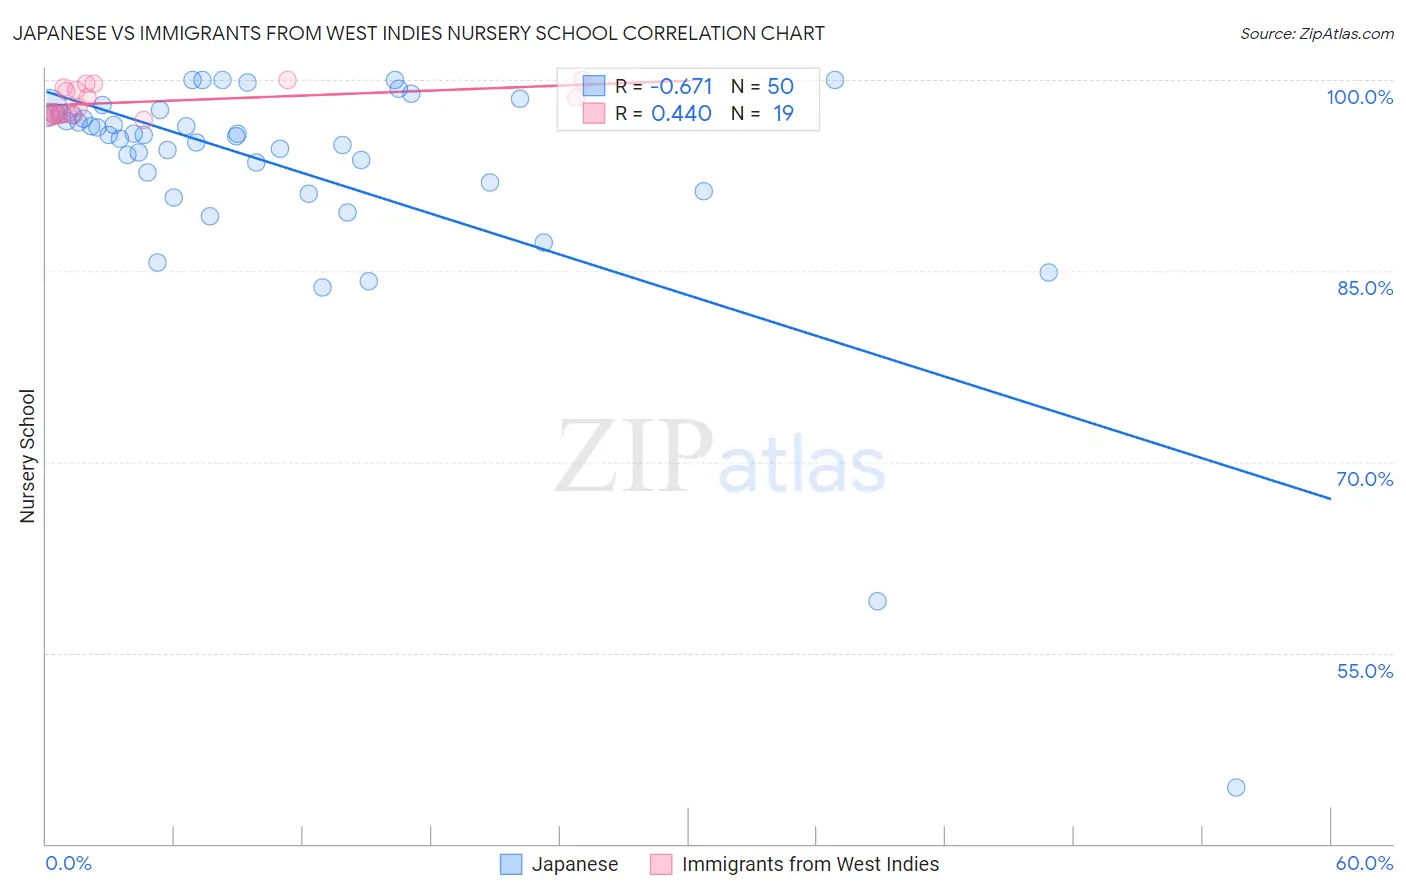
Japanese vs Immigrants from West Indies Nursery School Correlation Chart
The statistical analysis conducted on geographies consisting of 249,183,224 people shows a significant negative correlation between the proportion of Japanese and percentage of population with at least nursery school education in the United States with a correlation coefficient (R) of -0.671 and weighted average of 96.7%. Similarly, the statistical analysis conducted on geographies consisting of 72,457,514 people shows a moderate positive correlation between the proportion of Immigrants from West Indies and percentage of population with at least nursery school education in the United States with a correlation coefficient (R) of 0.440 and weighted average of 97.4%, a difference of 0.72%.
Nursery School Correlation Summary
| Measurement | Japanese | Immigrants from West Indies |
| Minimum | 44.4% | 96.8% |
| Maximum | 100.0% | 100.0% |
| Range | 55.6% | 3.2% |
| Mean | 93.0% | 98.3% |
| Median | 95.6% | 97.8% |
| Interquartile 25% (IQ1) | 92.0% | 97.2% |
| Interquartile 75% (IQ3) | 97.4% | 99.4% |
| Interquartile Range (IQR) | 5.4% | 2.2% |
| Standard Deviation (Sample) | 9.6% | 1.1% |
| Standard Deviation (Population) | 9.5% | 1.1% |
Similar Demographics by Nursery School
Demographics Similar to Japanese by Nursery School
In terms of nursery school, the demographic groups most similar to Japanese are Immigrants from Vietnam (96.7%, a difference of 0.010%), Immigrants from Armenia (96.7%, a difference of 0.020%), Yakama (96.6%, a difference of 0.040%), Immigrants from Latin America (96.7%, a difference of 0.060%), and Central American (96.6%, a difference of 0.060%).
| Demographics | Rating | Rank | Nursery School |
| Immigrants | Honduras | 0.0 /100 | #323 | Tragic 96.9% |
| Vietnamese | 0.0 /100 | #324 | Tragic 96.8% |
| Dominicans | 0.0 /100 | #325 | Tragic 96.8% |
| Indonesians | 0.0 /100 | #326 | Tragic 96.8% |
| Mexicans | 0.0 /100 | #327 | Tragic 96.8% |
| Immigrants | Latin America | 0.0 /100 | #328 | Tragic 96.7% |
| Immigrants | Vietnam | 0.0 /100 | #329 | Tragic 96.7% |
| Japanese | 0.0 /100 | #330 | Tragic 96.7% |
| Immigrants | Armenia | 0.0 /100 | #331 | Tragic 96.7% |
| Yakama | 0.0 /100 | #332 | Tragic 96.6% |
| Central Americans | 0.0 /100 | #333 | Tragic 96.6% |
| Immigrants | Dominican Republic | 0.0 /100 | #334 | Tragic 96.6% |
| Bangladeshis | 0.0 /100 | #335 | Tragic 96.6% |
| Guatemalans | 0.0 /100 | #336 | Tragic 96.6% |
| Immigrants | Cambodia | 0.0 /100 | #337 | Tragic 96.5% |
Demographics Similar to Immigrants from West Indies by Nursery School
In terms of nursery school, the demographic groups most similar to Immigrants from West Indies are Immigrants from Trinidad and Tobago (97.4%, a difference of 0.0%), Immigrants from Barbados (97.4%, a difference of 0.020%), Immigrants from Portugal (97.4%, a difference of 0.020%), Immigrants from Hong Kong (97.4%, a difference of 0.030%), and Immigrants from Ghana (97.4%, a difference of 0.040%).
| Demographics | Rating | Rank | Nursery School |
| Immigrants | Philippines | 0.1 /100 | #276 | Tragic 97.5% |
| Immigrants | Western Africa | 0.1 /100 | #277 | Tragic 97.4% |
| Immigrants | Uzbekistan | 0.1 /100 | #278 | Tragic 97.4% |
| Immigrants | Ghana | 0.1 /100 | #279 | Tragic 97.4% |
| Barbadians | 0.0 /100 | #280 | Tragic 97.4% |
| Trinidadians and Tobagonians | 0.0 /100 | #281 | Tragic 97.4% |
| Afghans | 0.0 /100 | #282 | Tragic 97.4% |
| Immigrants | West Indies | 0.0 /100 | #283 | Tragic 97.4% |
| Immigrants | Trinidad and Tobago | 0.0 /100 | #284 | Tragic 97.4% |
| Immigrants | Barbados | 0.0 /100 | #285 | Tragic 97.4% |
| Immigrants | Portugal | 0.0 /100 | #286 | Tragic 97.4% |
| Immigrants | Hong Kong | 0.0 /100 | #287 | Tragic 97.4% |
| Immigrants | Thailand | 0.0 /100 | #288 | Tragic 97.3% |
| Immigrants | St. Vincent and the Grenadines | 0.0 /100 | #289 | Tragic 97.3% |
| Immigrants | Afghanistan | 0.0 /100 | #290 | Tragic 97.3% |