Japanese vs Immigrants from Fiji In Labor Force | Age 35-44
COMPARE
Japanese
Immigrants from Fiji
In Labor Force | Age 35-44
In Labor Force | Age 35-44 Comparison
Japanese
Immigrants from Fiji
83.6%
IN LABOR FORCE | AGE 35-44
0.3/ 100
METRIC RATING
256th/ 347
METRIC RANK
83.2%
IN LABOR FORCE | AGE 35-44
0.0/ 100
METRIC RATING
272nd/ 347
METRIC RANK
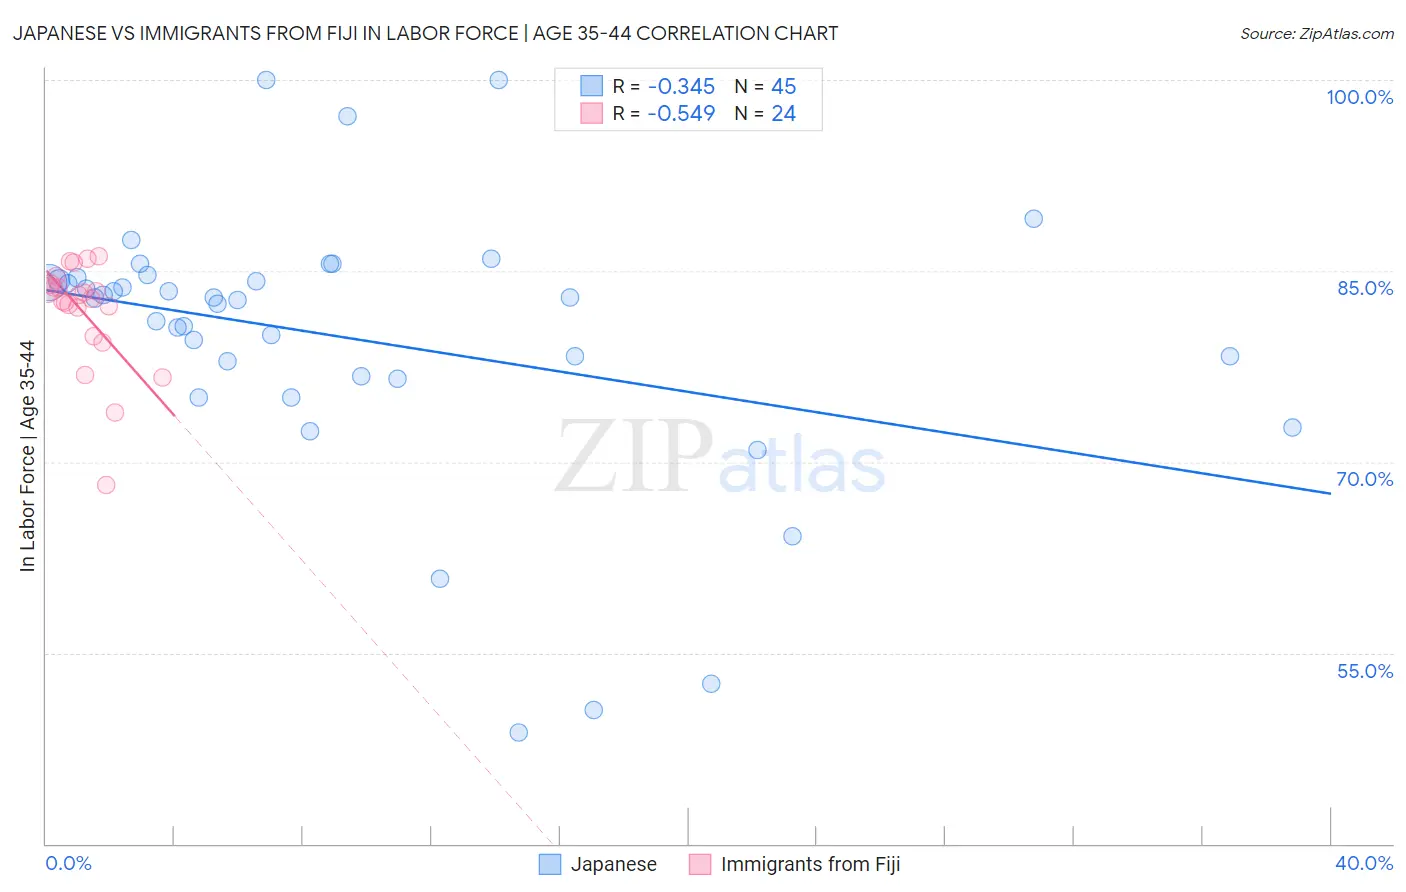
Japanese vs Immigrants from Fiji In Labor Force | Age 35-44 Correlation Chart
The statistical analysis conducted on geographies consisting of 249,106,093 people shows a mild negative correlation between the proportion of Japanese and labor force participation rate among population between the ages 35 and 44 in the United States with a correlation coefficient (R) of -0.345 and weighted average of 83.6%. Similarly, the statistical analysis conducted on geographies consisting of 93,754,712 people shows a substantial negative correlation between the proportion of Immigrants from Fiji and labor force participation rate among population between the ages 35 and 44 in the United States with a correlation coefficient (R) of -0.549 and weighted average of 83.2%, a difference of 0.42%.
In Labor Force | Age 35-44 Correlation Summary
| Measurement | Japanese | Immigrants from Fiji |
| Minimum | 48.7% | 68.2% |
| Maximum | 100.0% | 86.2% |
| Range | 51.3% | 18.0% |
| Mean | 79.7% | 81.8% |
| Median | 82.9% | 83.0% |
| Interquartile 25% (IQ1) | 76.6% | 81.0% |
| Interquartile 75% (IQ3) | 84.4% | 83.8% |
| Interquartile Range (IQR) | 7.8% | 2.8% |
| Standard Deviation (Sample) | 10.7% | 4.2% |
| Standard Deviation (Population) | 10.6% | 4.1% |
Demographics Similar to Japanese and Immigrants from Fiji by In Labor Force | Age 35-44
In terms of in labor force | age 35-44, the demographic groups most similar to Japanese are Immigrants from the Azores (83.6%, a difference of 0.020%), Basque (83.6%, a difference of 0.020%), Tongan (83.6%, a difference of 0.040%), Tsimshian (83.5%, a difference of 0.040%), and Immigrants from El Salvador (83.5%, a difference of 0.060%). Similarly, the demographic groups most similar to Immigrants from Fiji are Spanish (83.2%, a difference of 0.0%), Immigrants from Honduras (83.3%, a difference of 0.020%), French American Indian (83.2%, a difference of 0.020%), Nonimmigrants (83.2%, a difference of 0.020%), and Immigrants from Grenada (83.3%, a difference of 0.14%).
| Demographics | Rating | Rank | In Labor Force | Age 35-44 |
| Tongans | 0.4 /100 | #254 | Tragic 83.6% |
| Immigrants | Azores | 0.3 /100 | #255 | Tragic 83.6% |
| Japanese | 0.3 /100 | #256 | Tragic 83.6% |
| Basques | 0.3 /100 | #257 | Tragic 83.6% |
| Tsimshian | 0.2 /100 | #258 | Tragic 83.5% |
| Immigrants | El Salvador | 0.2 /100 | #259 | Tragic 83.5% |
| Vietnamese | 0.2 /100 | #260 | Tragic 83.5% |
| Immigrants | Dominica | 0.2 /100 | #261 | Tragic 83.5% |
| Immigrants | Congo | 0.2 /100 | #262 | Tragic 83.5% |
| Iroquois | 0.2 /100 | #263 | Tragic 83.5% |
| Scotch-Irish | 0.1 /100 | #264 | Tragic 83.5% |
| Central Americans | 0.1 /100 | #265 | Tragic 83.5% |
| Spaniards | 0.1 /100 | #266 | Tragic 83.4% |
| Guamanians/Chamorros | 0.1 /100 | #267 | Tragic 83.4% |
| Hondurans | 0.1 /100 | #268 | Tragic 83.4% |
| Immigrants | Grenada | 0.1 /100 | #269 | Tragic 83.3% |
| Immigrants | Honduras | 0.0 /100 | #270 | Tragic 83.3% |
| French American Indians | 0.0 /100 | #271 | Tragic 83.2% |
| Immigrants | Fiji | 0.0 /100 | #272 | Tragic 83.2% |
| Spanish | 0.0 /100 | #273 | Tragic 83.2% |
| Immigrants | Nonimmigrants | 0.0 /100 | #274 | Tragic 83.2% |