Japanese vs Immigrants from Caribbean In Labor Force | Age 35-44
COMPARE
Japanese
Immigrants from Caribbean
In Labor Force | Age 35-44
In Labor Force | Age 35-44 Comparison
Japanese
Immigrants from Caribbean
83.6%
IN LABOR FORCE | AGE 35-44
0.3/ 100
METRIC RATING
256th/ 347
METRIC RANK
84.2%
IN LABOR FORCE | AGE 35-44
25.7/ 100
METRIC RATING
195th/ 347
METRIC RANK
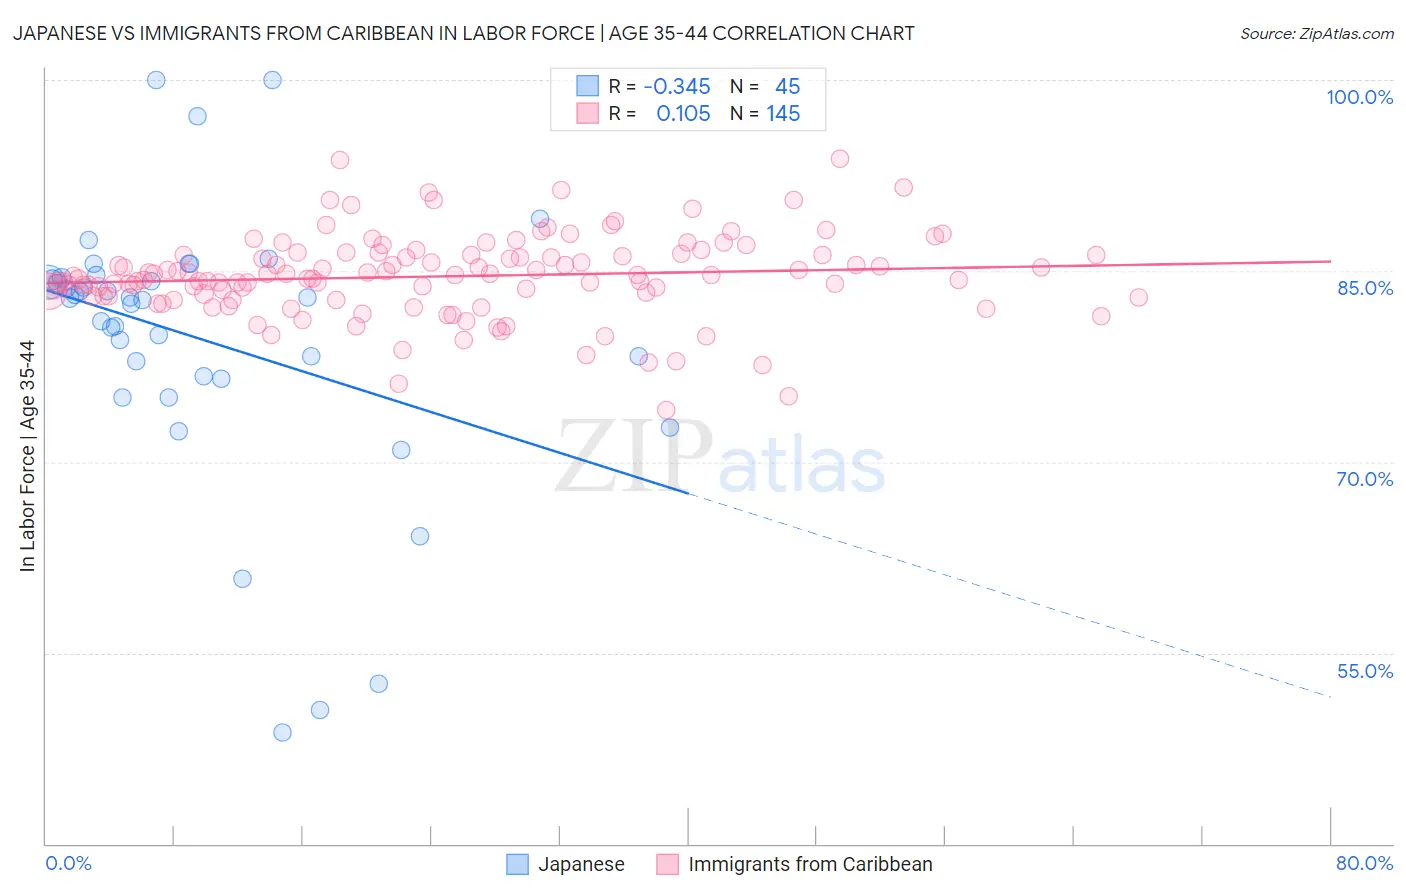
Japanese vs Immigrants from Caribbean In Labor Force | Age 35-44 Correlation Chart
The statistical analysis conducted on geographies consisting of 249,106,093 people shows a mild negative correlation between the proportion of Japanese and labor force participation rate among population between the ages 35 and 44 in the United States with a correlation coefficient (R) of -0.345 and weighted average of 83.6%. Similarly, the statistical analysis conducted on geographies consisting of 449,756,256 people shows a poor positive correlation between the proportion of Immigrants from Caribbean and labor force participation rate among population between the ages 35 and 44 in the United States with a correlation coefficient (R) of 0.105 and weighted average of 84.2%, a difference of 0.77%.
In Labor Force | Age 35-44 Correlation Summary
| Measurement | Japanese | Immigrants from Caribbean |
| Minimum | 48.7% | 74.1% |
| Maximum | 100.0% | 93.8% |
| Range | 51.3% | 19.7% |
| Mean | 79.7% | 84.6% |
| Median | 82.9% | 84.6% |
| Interquartile 25% (IQ1) | 76.6% | 83.0% |
| Interquartile 75% (IQ3) | 84.4% | 86.3% |
| Interquartile Range (IQR) | 7.8% | 3.3% |
| Standard Deviation (Sample) | 10.7% | 3.3% |
| Standard Deviation (Population) | 10.6% | 3.2% |
Similar Demographics by In Labor Force | Age 35-44
Demographics Similar to Japanese by In Labor Force | Age 35-44
In terms of in labor force | age 35-44, the demographic groups most similar to Japanese are Immigrants from the Azores (83.6%, a difference of 0.020%), Basque (83.6%, a difference of 0.020%), Tongan (83.6%, a difference of 0.040%), Tsimshian (83.5%, a difference of 0.040%), and Salvadoran (83.6%, a difference of 0.060%).
| Demographics | Rating | Rank | In Labor Force | Age 35-44 |
| Immigrants | St. Vincent and the Grenadines | 0.7 /100 | #249 | Tragic 83.7% |
| Whites/Caucasians | 0.5 /100 | #250 | Tragic 83.6% |
| Salvadorans | 0.4 /100 | #251 | Tragic 83.6% |
| Immigrants | Guyana | 0.4 /100 | #252 | Tragic 83.6% |
| Lebanese | 0.4 /100 | #253 | Tragic 83.6% |
| Tongans | 0.4 /100 | #254 | Tragic 83.6% |
| Immigrants | Azores | 0.3 /100 | #255 | Tragic 83.6% |
| Japanese | 0.3 /100 | #256 | Tragic 83.6% |
| Basques | 0.3 /100 | #257 | Tragic 83.6% |
| Tsimshian | 0.2 /100 | #258 | Tragic 83.5% |
| Immigrants | El Salvador | 0.2 /100 | #259 | Tragic 83.5% |
| Vietnamese | 0.2 /100 | #260 | Tragic 83.5% |
| Immigrants | Dominica | 0.2 /100 | #261 | Tragic 83.5% |
| Immigrants | Congo | 0.2 /100 | #262 | Tragic 83.5% |
| Iroquois | 0.2 /100 | #263 | Tragic 83.5% |
Demographics Similar to Immigrants from Caribbean by In Labor Force | Age 35-44
In terms of in labor force | age 35-44, the demographic groups most similar to Immigrants from Caribbean are Immigrants from Indonesia (84.2%, a difference of 0.0%), Immigrants from Vietnam (84.2%, a difference of 0.010%), Hungarian (84.2%, a difference of 0.010%), Immigrants from England (84.2%, a difference of 0.010%), and Immigrants from Western Europe (84.2%, a difference of 0.010%).
| Demographics | Rating | Rank | In Labor Force | Age 35-44 |
| South Africans | 34.1 /100 | #188 | Fair 84.3% |
| Immigrants | Denmark | 33.7 /100 | #189 | Fair 84.3% |
| Portuguese | 31.9 /100 | #190 | Fair 84.3% |
| Immigrants | Philippines | 27.9 /100 | #191 | Fair 84.2% |
| Immigrants | Vietnam | 27.4 /100 | #192 | Fair 84.2% |
| Hungarians | 26.8 /100 | #193 | Fair 84.2% |
| Immigrants | Indonesia | 25.7 /100 | #194 | Fair 84.2% |
| Immigrants | Caribbean | 25.7 /100 | #195 | Fair 84.2% |
| Immigrants | England | 25.0 /100 | #196 | Fair 84.2% |
| Immigrants | Western Europe | 24.7 /100 | #197 | Fair 84.2% |
| Ecuadorians | 24.0 /100 | #198 | Fair 84.2% |
| Syrians | 23.2 /100 | #199 | Fair 84.2% |
| Moroccans | 23.2 /100 | #200 | Fair 84.2% |
| British | 23.0 /100 | #201 | Fair 84.2% |
| Immigrants | Uzbekistan | 22.8 /100 | #202 | Fair 84.2% |