Japanese vs Immigrants from the Azores In Labor Force | Age 20-64
COMPARE
Japanese
Immigrants from the Azores
In Labor Force | Age 20-64
In Labor Force | Age 20-64 Comparison
Japanese
Immigrants from the Azores
79.1%
IN LABOR FORCE | AGE 20-64
4.0/ 100
METRIC RATING
233rd/ 347
METRIC RANK
77.8%
IN LABOR FORCE | AGE 20-64
0.0/ 100
METRIC RATING
292nd/ 347
METRIC RANK
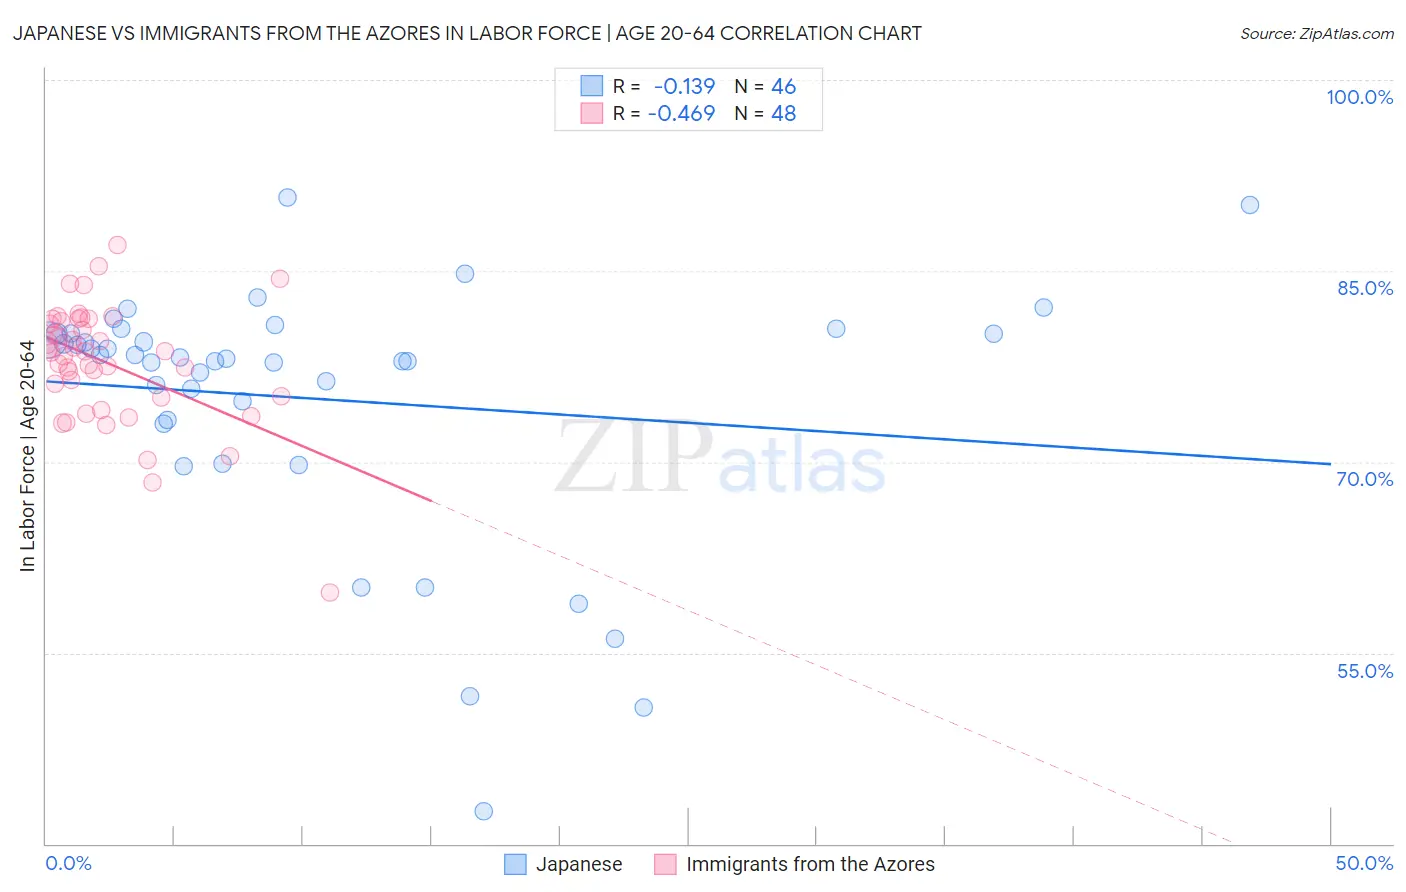
Japanese vs Immigrants from the Azores In Labor Force | Age 20-64 Correlation Chart
The statistical analysis conducted on geographies consisting of 249,187,220 people shows a poor negative correlation between the proportion of Japanese and labor force participation rate among population between the ages 20 and 64 in the United States with a correlation coefficient (R) of -0.139 and weighted average of 79.1%. Similarly, the statistical analysis conducted on geographies consisting of 46,256,974 people shows a moderate negative correlation between the proportion of Immigrants from the Azores and labor force participation rate among population between the ages 20 and 64 in the United States with a correlation coefficient (R) of -0.469 and weighted average of 77.8%, a difference of 1.6%.
In Labor Force | Age 20-64 Correlation Summary
| Measurement | Japanese | Immigrants from the Azores |
| Minimum | 42.6% | 59.7% |
| Maximum | 90.8% | 87.0% |
| Range | 48.2% | 27.3% |
| Mean | 75.0% | 77.8% |
| Median | 78.2% | 78.6% |
| Interquartile 25% (IQ1) | 73.3% | 75.1% |
| Interquartile 75% (IQ3) | 80.1% | 81.1% |
| Interquartile Range (IQR) | 6.8% | 6.0% |
| Standard Deviation (Sample) | 10.0% | 4.8% |
| Standard Deviation (Population) | 9.9% | 4.8% |
Similar Demographics by In Labor Force | Age 20-64
Demographics Similar to Japanese by In Labor Force | Age 20-64
In terms of in labor force | age 20-64, the demographic groups most similar to Japanese are Guamanian/Chamorro (79.1%, a difference of 0.030%), Immigrants from Canada (79.0%, a difference of 0.040%), Lebanese (79.1%, a difference of 0.050%), Tlingit-Haida (79.0%, a difference of 0.050%), and Samoan (79.0%, a difference of 0.060%).
| Demographics | Rating | Rank | In Labor Force | Age 20-64 |
| Central Americans | 5.9 /100 | #226 | Tragic 79.1% |
| Immigrants | Western Europe | 5.9 /100 | #227 | Tragic 79.1% |
| Panamanians | 5.7 /100 | #228 | Tragic 79.1% |
| Alsatians | 5.7 /100 | #229 | Tragic 79.1% |
| Native Hawaiians | 5.6 /100 | #230 | Tragic 79.1% |
| Lebanese | 5.1 /100 | #231 | Tragic 79.1% |
| Guamanians/Chamorros | 4.5 /100 | #232 | Tragic 79.1% |
| Japanese | 4.0 /100 | #233 | Tragic 79.1% |
| Immigrants | Canada | 3.2 /100 | #234 | Tragic 79.0% |
| Tlingit-Haida | 3.2 /100 | #235 | Tragic 79.0% |
| Samoans | 2.9 /100 | #236 | Tragic 79.0% |
| Immigrants | North America | 2.9 /100 | #237 | Tragic 79.0% |
| Immigrants | Jamaica | 2.6 /100 | #238 | Tragic 79.0% |
| Welsh | 2.4 /100 | #239 | Tragic 79.0% |
| Trinidadians and Tobagonians | 2.3 /100 | #240 | Tragic 79.0% |
Demographics Similar to Immigrants from the Azores by In Labor Force | Age 20-64
In terms of in labor force | age 20-64, the demographic groups most similar to Immigrants from the Azores are Delaware (77.8%, a difference of 0.040%), Spanish American (77.8%, a difference of 0.050%), Immigrants from Bangladesh (77.9%, a difference of 0.10%), African (77.9%, a difference of 0.12%), and Immigrants from Central America (77.7%, a difference of 0.12%).
| Demographics | Rating | Rank | In Labor Force | Age 20-64 |
| Osage | 0.0 /100 | #285 | Tragic 78.0% |
| Immigrants | Belize | 0.0 /100 | #286 | Tragic 78.0% |
| Vietnamese | 0.0 /100 | #287 | Tragic 78.0% |
| Hmong | 0.0 /100 | #288 | Tragic 77.9% |
| Africans | 0.0 /100 | #289 | Tragic 77.9% |
| Immigrants | Bangladesh | 0.0 /100 | #290 | Tragic 77.9% |
| Spanish Americans | 0.0 /100 | #291 | Tragic 77.8% |
| Immigrants | Azores | 0.0 /100 | #292 | Tragic 77.8% |
| Delaware | 0.0 /100 | #293 | Tragic 77.8% |
| Immigrants | Central America | 0.0 /100 | #294 | Tragic 77.7% |
| Immigrants | Grenada | 0.0 /100 | #295 | Tragic 77.7% |
| Immigrants | Dominican Republic | 0.0 /100 | #296 | Tragic 77.7% |
| Dominicans | 0.0 /100 | #297 | Tragic 77.7% |
| Cree | 0.0 /100 | #298 | Tragic 77.7% |
| Hispanics or Latinos | 0.0 /100 | #299 | Tragic 77.6% |