Yup'ik vs Immigrants from the Azores In Labor Force | Age 20-64
COMPARE
Yup'ik
Immigrants from the Azores
In Labor Force | Age 20-64
In Labor Force | Age 20-64 Comparison
Yup'ik
Immigrants from the Azores
73.2%
IN LABOR FORCE | AGE 20-64
0.0/ 100
METRIC RATING
337th/ 347
METRIC RANK
77.8%
IN LABOR FORCE | AGE 20-64
0.0/ 100
METRIC RATING
292nd/ 347
METRIC RANK
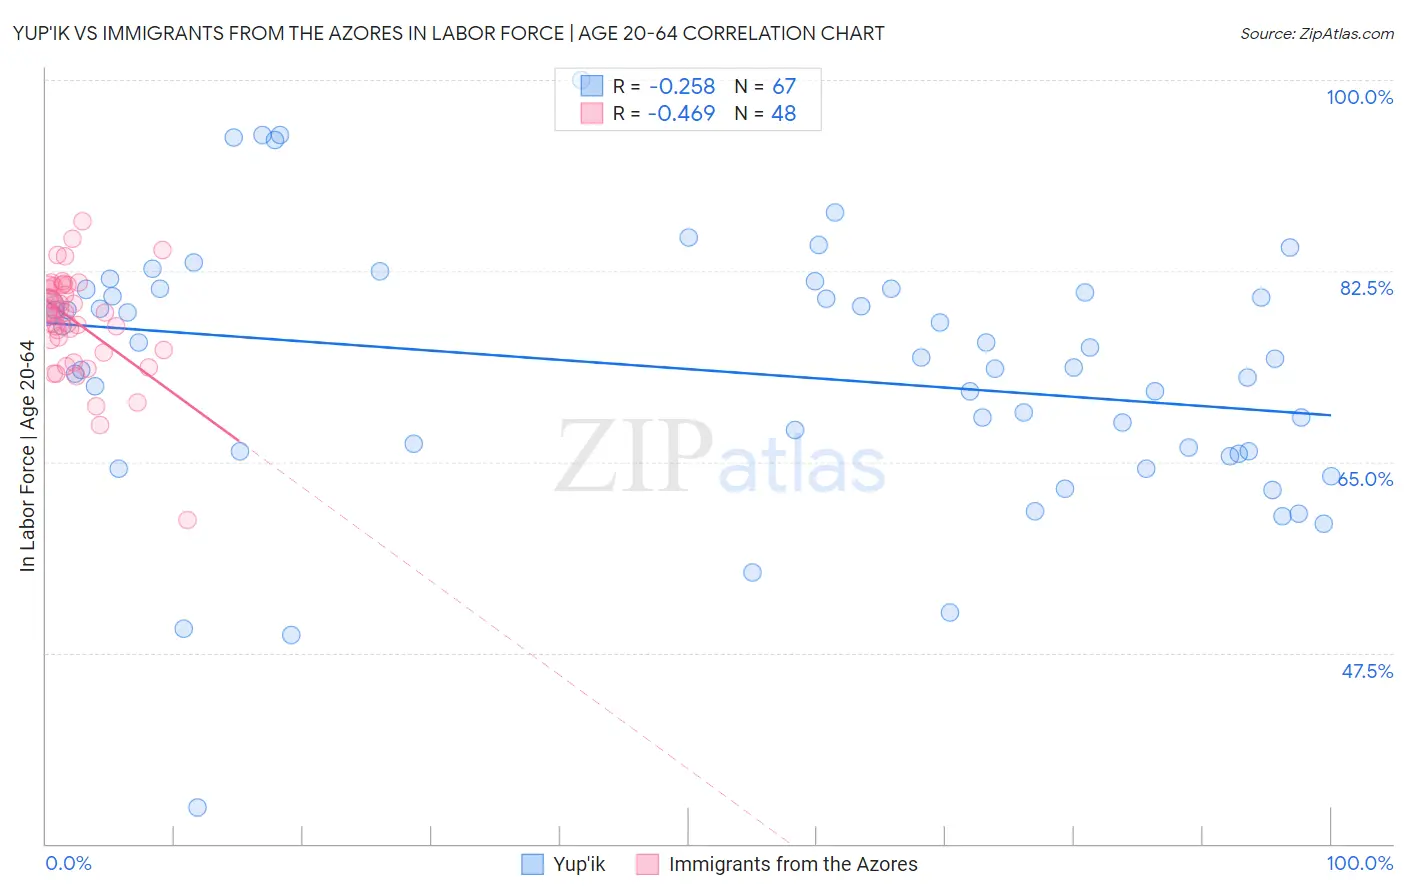
Yup'ik vs Immigrants from the Azores In Labor Force | Age 20-64 Correlation Chart
The statistical analysis conducted on geographies consisting of 39,964,003 people shows a weak negative correlation between the proportion of Yup'ik and labor force participation rate among population between the ages 20 and 64 in the United States with a correlation coefficient (R) of -0.258 and weighted average of 73.2%. Similarly, the statistical analysis conducted on geographies consisting of 46,256,974 people shows a moderate negative correlation between the proportion of Immigrants from the Azores and labor force participation rate among population between the ages 20 and 64 in the United States with a correlation coefficient (R) of -0.469 and weighted average of 77.8%, a difference of 6.3%.
In Labor Force | Age 20-64 Correlation Summary
| Measurement | Yup'ik | Immigrants from the Azores |
| Minimum | 33.3% | 59.7% |
| Maximum | 100.0% | 87.0% |
| Range | 66.7% | 27.3% |
| Mean | 73.4% | 77.8% |
| Median | 74.4% | 78.6% |
| Interquartile 25% (IQ1) | 66.0% | 75.1% |
| Interquartile 75% (IQ3) | 80.8% | 81.1% |
| Interquartile Range (IQR) | 14.8% | 6.0% |
| Standard Deviation (Sample) | 11.9% | 4.8% |
| Standard Deviation (Population) | 11.8% | 4.8% |
Similar Demographics by In Labor Force | Age 20-64
Demographics Similar to Yup'ik by In Labor Force | Age 20-64
In terms of in labor force | age 20-64, the demographic groups most similar to Yup'ik are Crow (73.3%, a difference of 0.12%), Puerto Rican (73.1%, a difference of 0.21%), Ute (73.7%, a difference of 0.63%), Apache (73.7%, a difference of 0.64%), and Houma (72.7%, a difference of 0.64%).
| Demographics | Rating | Rank | In Labor Force | Age 20-64 |
| Colville | 0.0 /100 | #330 | Tragic 74.8% |
| Paiute | 0.0 /100 | #331 | Tragic 74.7% |
| Arapaho | 0.0 /100 | #332 | Tragic 74.4% |
| Natives/Alaskans | 0.0 /100 | #333 | Tragic 73.9% |
| Apache | 0.0 /100 | #334 | Tragic 73.7% |
| Ute | 0.0 /100 | #335 | Tragic 73.7% |
| Crow | 0.0 /100 | #336 | Tragic 73.3% |
| Yup'ik | 0.0 /100 | #337 | Tragic 73.2% |
| Puerto Ricans | 0.0 /100 | #338 | Tragic 73.1% |
| Houma | 0.0 /100 | #339 | Tragic 72.7% |
| Pueblo | 0.0 /100 | #340 | Tragic 72.6% |
| Immigrants | Yemen | 0.0 /100 | #341 | Tragic 72.3% |
| Yuman | 0.0 /100 | #342 | Tragic 71.7% |
| Hopi | 0.0 /100 | #343 | Tragic 71.7% |
| Lumbee | 0.0 /100 | #344 | Tragic 70.6% |
Demographics Similar to Immigrants from the Azores by In Labor Force | Age 20-64
In terms of in labor force | age 20-64, the demographic groups most similar to Immigrants from the Azores are Delaware (77.8%, a difference of 0.040%), Spanish American (77.8%, a difference of 0.050%), Immigrants from Bangladesh (77.9%, a difference of 0.10%), African (77.9%, a difference of 0.12%), and Immigrants from Central America (77.7%, a difference of 0.12%).
| Demographics | Rating | Rank | In Labor Force | Age 20-64 |
| Osage | 0.0 /100 | #285 | Tragic 78.0% |
| Immigrants | Belize | 0.0 /100 | #286 | Tragic 78.0% |
| Vietnamese | 0.0 /100 | #287 | Tragic 78.0% |
| Hmong | 0.0 /100 | #288 | Tragic 77.9% |
| Africans | 0.0 /100 | #289 | Tragic 77.9% |
| Immigrants | Bangladesh | 0.0 /100 | #290 | Tragic 77.9% |
| Spanish Americans | 0.0 /100 | #291 | Tragic 77.8% |
| Immigrants | Azores | 0.0 /100 | #292 | Tragic 77.8% |
| Delaware | 0.0 /100 | #293 | Tragic 77.8% |
| Immigrants | Central America | 0.0 /100 | #294 | Tragic 77.7% |
| Immigrants | Grenada | 0.0 /100 | #295 | Tragic 77.7% |
| Immigrants | Dominican Republic | 0.0 /100 | #296 | Tragic 77.7% |
| Dominicans | 0.0 /100 | #297 | Tragic 77.7% |
| Cree | 0.0 /100 | #298 | Tragic 77.7% |
| Hispanics or Latinos | 0.0 /100 | #299 | Tragic 77.6% |