Japanese vs Indian (Asian) In Labor Force | Age 20-64
COMPARE
Japanese
Indian (Asian)
In Labor Force | Age 20-64
In Labor Force | Age 20-64 Comparison
Japanese
Indians (Asian)
79.1%
IN LABOR FORCE | AGE 20-64
4.0/ 100
METRIC RATING
233rd/ 347
METRIC RANK
79.9%
IN LABOR FORCE | AGE 20-64
87.7/ 100
METRIC RATING
132nd/ 347
METRIC RANK
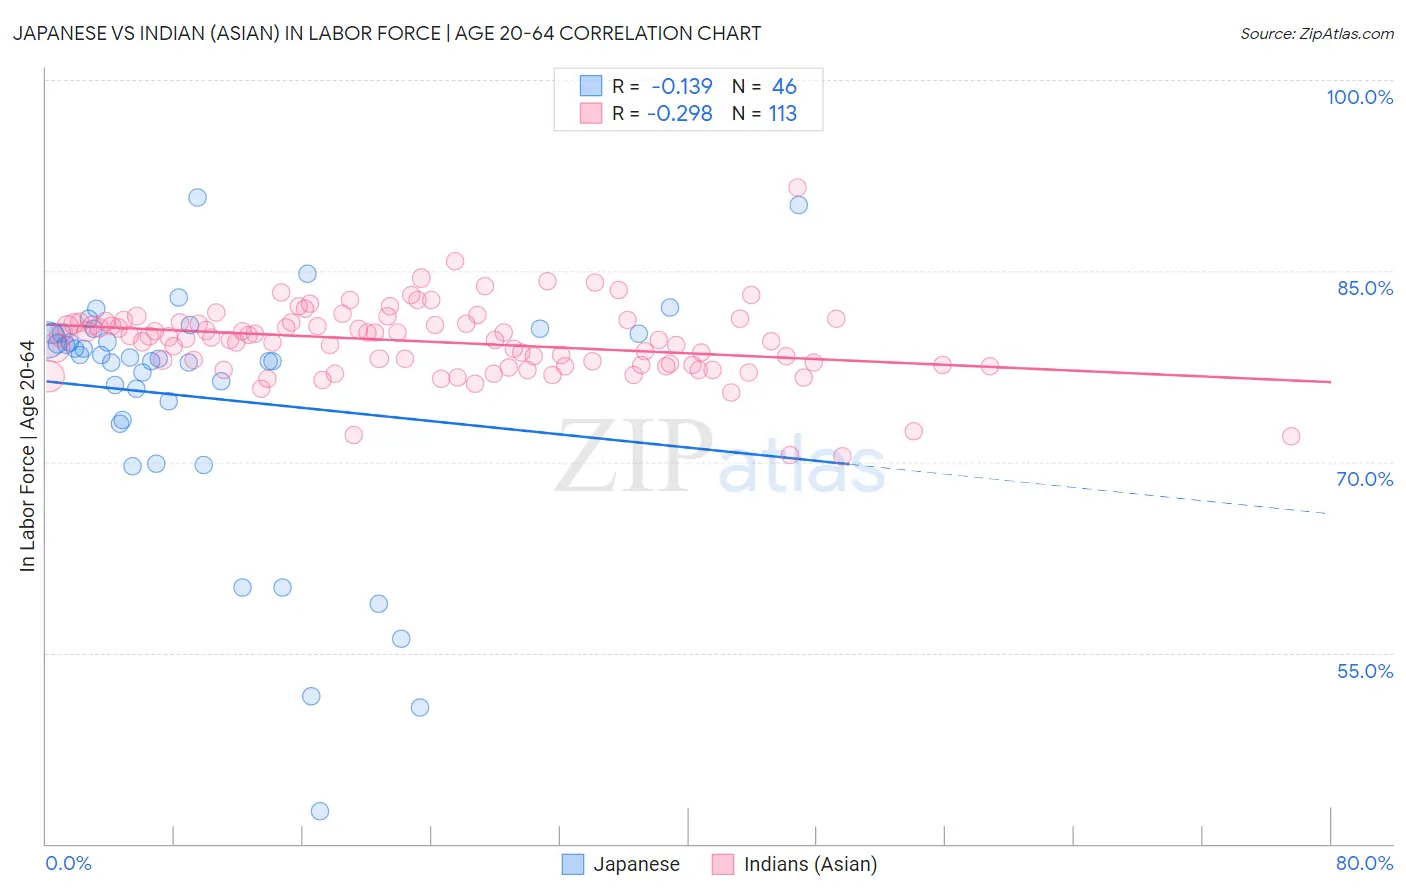
Japanese vs Indian (Asian) In Labor Force | Age 20-64 Correlation Chart
The statistical analysis conducted on geographies consisting of 249,187,220 people shows a poor negative correlation between the proportion of Japanese and labor force participation rate among population between the ages 20 and 64 in the United States with a correlation coefficient (R) of -0.139 and weighted average of 79.1%. Similarly, the statistical analysis conducted on geographies consisting of 495,369,997 people shows a weak negative correlation between the proportion of Indians (Asian) and labor force participation rate among population between the ages 20 and 64 in the United States with a correlation coefficient (R) of -0.298 and weighted average of 79.9%, a difference of 1.0%.
In Labor Force | Age 20-64 Correlation Summary
| Measurement | Japanese | Indian (Asian) |
| Minimum | 42.6% | 70.4% |
| Maximum | 90.8% | 91.6% |
| Range | 48.2% | 21.2% |
| Mean | 75.0% | 79.5% |
| Median | 78.2% | 79.8% |
| Interquartile 25% (IQ1) | 73.3% | 77.6% |
| Interquartile 75% (IQ3) | 80.1% | 81.0% |
| Interquartile Range (IQR) | 6.8% | 3.3% |
| Standard Deviation (Sample) | 10.0% | 3.0% |
| Standard Deviation (Population) | 9.9% | 2.9% |
Similar Demographics by In Labor Force | Age 20-64
Demographics Similar to Japanese by In Labor Force | Age 20-64
In terms of in labor force | age 20-64, the demographic groups most similar to Japanese are Guamanian/Chamorro (79.1%, a difference of 0.030%), Immigrants from Canada (79.0%, a difference of 0.040%), Lebanese (79.1%, a difference of 0.050%), Tlingit-Haida (79.0%, a difference of 0.050%), and Samoan (79.0%, a difference of 0.060%).
| Demographics | Rating | Rank | In Labor Force | Age 20-64 |
| Central Americans | 5.9 /100 | #226 | Tragic 79.1% |
| Immigrants | Western Europe | 5.9 /100 | #227 | Tragic 79.1% |
| Panamanians | 5.7 /100 | #228 | Tragic 79.1% |
| Alsatians | 5.7 /100 | #229 | Tragic 79.1% |
| Native Hawaiians | 5.6 /100 | #230 | Tragic 79.1% |
| Lebanese | 5.1 /100 | #231 | Tragic 79.1% |
| Guamanians/Chamorros | 4.5 /100 | #232 | Tragic 79.1% |
| Japanese | 4.0 /100 | #233 | Tragic 79.1% |
| Immigrants | Canada | 3.2 /100 | #234 | Tragic 79.0% |
| Tlingit-Haida | 3.2 /100 | #235 | Tragic 79.0% |
| Samoans | 2.9 /100 | #236 | Tragic 79.0% |
| Immigrants | North America | 2.9 /100 | #237 | Tragic 79.0% |
| Immigrants | Jamaica | 2.6 /100 | #238 | Tragic 79.0% |
| Welsh | 2.4 /100 | #239 | Tragic 79.0% |
| Trinidadians and Tobagonians | 2.3 /100 | #240 | Tragic 79.0% |
Demographics Similar to Indians (Asian) by In Labor Force | Age 20-64
In terms of in labor force | age 20-64, the demographic groups most similar to Indians (Asian) are South American Indian (79.9%, a difference of 0.0%), Belgian (79.9%, a difference of 0.0%), Immigrants from Iran (79.9%, a difference of 0.010%), Italian (79.9%, a difference of 0.020%), and Immigrants from Zaire (79.9%, a difference of 0.020%).
| Demographics | Rating | Rank | In Labor Force | Age 20-64 |
| Danes | 91.5 /100 | #125 | Exceptional 79.9% |
| Immigrants | France | 90.7 /100 | #126 | Exceptional 79.9% |
| Immigrants | Czechoslovakia | 89.7 /100 | #127 | Excellent 79.9% |
| Immigrants | Eastern Asia | 89.4 /100 | #128 | Excellent 79.9% |
| Italians | 88.9 /100 | #129 | Excellent 79.9% |
| Immigrants | Zaire | 88.6 /100 | #130 | Excellent 79.9% |
| Immigrants | Iran | 88.3 /100 | #131 | Excellent 79.9% |
| Indians (Asian) | 87.7 /100 | #132 | Excellent 79.9% |
| South American Indians | 87.6 /100 | #133 | Excellent 79.9% |
| Belgians | 87.4 /100 | #134 | Excellent 79.9% |
| Ukrainians | 86.8 /100 | #135 | Excellent 79.9% |
| Immigrants | Singapore | 86.7 /100 | #136 | Excellent 79.9% |
| Immigrants | Ukraine | 86.5 /100 | #137 | Excellent 79.9% |
| Immigrants | Nigeria | 86.4 /100 | #138 | Excellent 79.9% |
| Immigrants | Spain | 83.9 /100 | #139 | Excellent 79.8% |