Japanese vs Albanian In Labor Force | Age 20-64
COMPARE
Japanese
Albanian
In Labor Force | Age 20-64
In Labor Force | Age 20-64 Comparison
Japanese
Albanians
79.1%
IN LABOR FORCE | AGE 20-64
4.0/ 100
METRIC RATING
233rd/ 347
METRIC RANK
80.2%
IN LABOR FORCE | AGE 20-64
98.6/ 100
METRIC RATING
69th/ 347
METRIC RANK
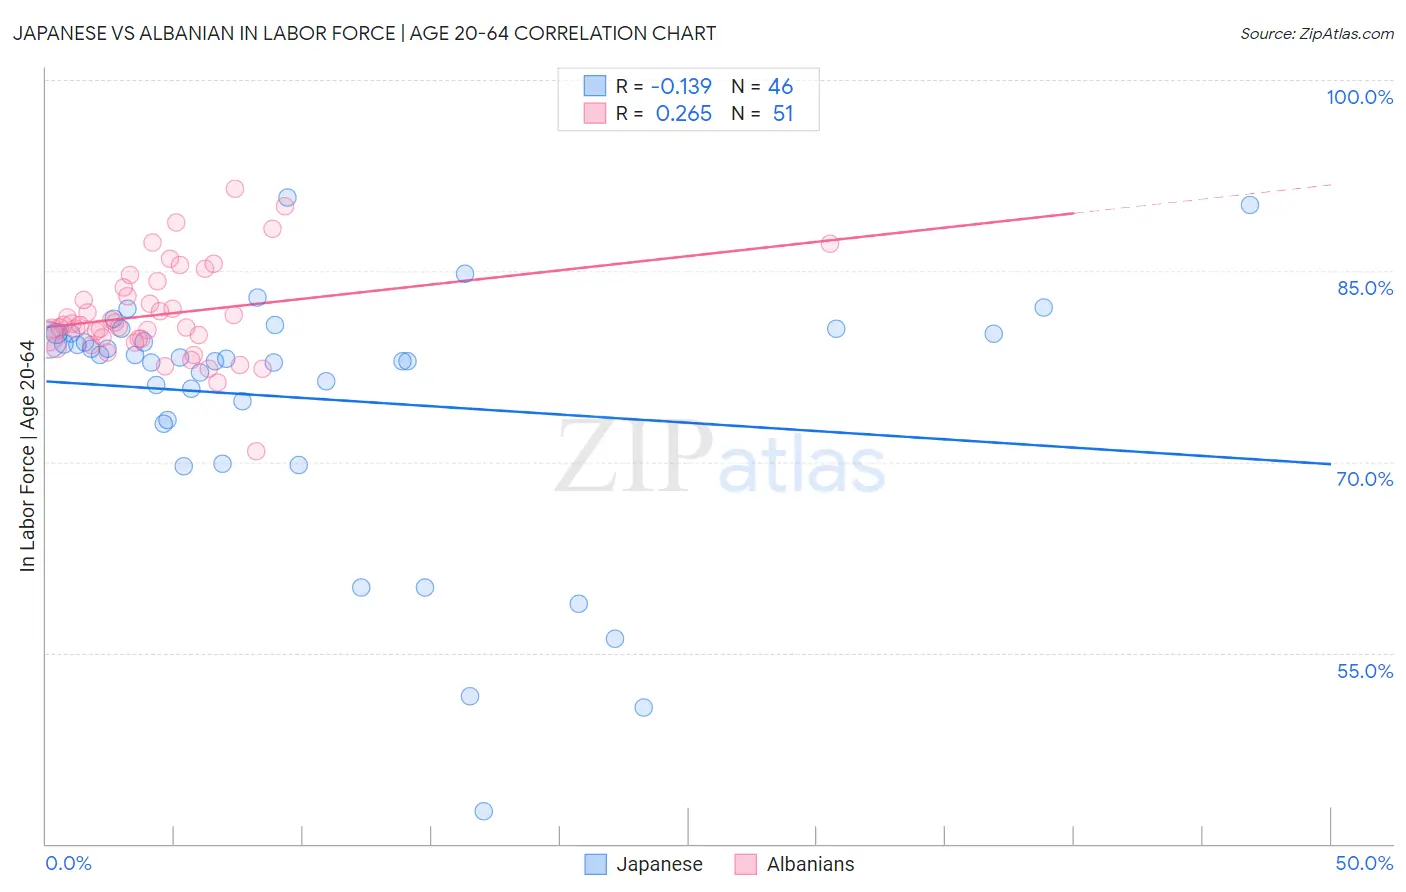
Japanese vs Albanian In Labor Force | Age 20-64 Correlation Chart
The statistical analysis conducted on geographies consisting of 249,187,220 people shows a poor negative correlation between the proportion of Japanese and labor force participation rate among population between the ages 20 and 64 in the United States with a correlation coefficient (R) of -0.139 and weighted average of 79.1%. Similarly, the statistical analysis conducted on geographies consisting of 193,264,914 people shows a weak positive correlation between the proportion of Albanians and labor force participation rate among population between the ages 20 and 64 in the United States with a correlation coefficient (R) of 0.265 and weighted average of 80.2%, a difference of 1.5%.
In Labor Force | Age 20-64 Correlation Summary
| Measurement | Japanese | Albanian |
| Minimum | 42.6% | 70.8% |
| Maximum | 90.8% | 91.5% |
| Range | 48.2% | 20.7% |
| Mean | 75.0% | 81.6% |
| Median | 78.2% | 80.8% |
| Interquartile 25% (IQ1) | 73.3% | 79.7% |
| Interquartile 75% (IQ3) | 80.1% | 83.7% |
| Interquartile Range (IQR) | 6.8% | 3.9% |
| Standard Deviation (Sample) | 10.0% | 3.8% |
| Standard Deviation (Population) | 9.9% | 3.7% |
Similar Demographics by In Labor Force | Age 20-64
Demographics Similar to Japanese by In Labor Force | Age 20-64
In terms of in labor force | age 20-64, the demographic groups most similar to Japanese are Guamanian/Chamorro (79.1%, a difference of 0.030%), Immigrants from Canada (79.0%, a difference of 0.040%), Lebanese (79.1%, a difference of 0.050%), Tlingit-Haida (79.0%, a difference of 0.050%), and Samoan (79.0%, a difference of 0.060%).
| Demographics | Rating | Rank | In Labor Force | Age 20-64 |
| Central Americans | 5.9 /100 | #226 | Tragic 79.1% |
| Immigrants | Western Europe | 5.9 /100 | #227 | Tragic 79.1% |
| Panamanians | 5.7 /100 | #228 | Tragic 79.1% |
| Alsatians | 5.7 /100 | #229 | Tragic 79.1% |
| Native Hawaiians | 5.6 /100 | #230 | Tragic 79.1% |
| Lebanese | 5.1 /100 | #231 | Tragic 79.1% |
| Guamanians/Chamorros | 4.5 /100 | #232 | Tragic 79.1% |
| Japanese | 4.0 /100 | #233 | Tragic 79.1% |
| Immigrants | Canada | 3.2 /100 | #234 | Tragic 79.0% |
| Tlingit-Haida | 3.2 /100 | #235 | Tragic 79.0% |
| Samoans | 2.9 /100 | #236 | Tragic 79.0% |
| Immigrants | North America | 2.9 /100 | #237 | Tragic 79.0% |
| Immigrants | Jamaica | 2.6 /100 | #238 | Tragic 79.0% |
| Welsh | 2.4 /100 | #239 | Tragic 79.0% |
| Trinidadians and Tobagonians | 2.3 /100 | #240 | Tragic 79.0% |
Demographics Similar to Albanians by In Labor Force | Age 20-64
In terms of in labor force | age 20-64, the demographic groups most similar to Albanians are Bhutanese (80.2%, a difference of 0.0%), Immigrants from Turkey (80.2%, a difference of 0.0%), Macedonian (80.2%, a difference of 0.010%), Taiwanese (80.2%, a difference of 0.010%), and Soviet Union (80.2%, a difference of 0.010%).
| Demographics | Rating | Rank | In Labor Force | Age 20-64 |
| Carpatho Rusyns | 98.8 /100 | #62 | Exceptional 80.3% |
| Immigrants | Korea | 98.8 /100 | #63 | Exceptional 80.3% |
| Immigrants | Albania | 98.7 /100 | #64 | Exceptional 80.3% |
| Lithuanians | 98.7 /100 | #65 | Exceptional 80.2% |
| Macedonians | 98.7 /100 | #66 | Exceptional 80.2% |
| Taiwanese | 98.6 /100 | #67 | Exceptional 80.2% |
| Bhutanese | 98.6 /100 | #68 | Exceptional 80.2% |
| Albanians | 98.6 /100 | #69 | Exceptional 80.2% |
| Immigrants | Turkey | 98.5 /100 | #70 | Exceptional 80.2% |
| Soviet Union | 98.5 /100 | #71 | Exceptional 80.2% |
| Eastern Europeans | 98.4 /100 | #72 | Exceptional 80.2% |
| Cypriots | 98.2 /100 | #73 | Exceptional 80.2% |
| Immigrants | Eastern Europe | 98.1 /100 | #74 | Exceptional 80.2% |
| Immigrants | Afghanistan | 97.9 /100 | #75 | Exceptional 80.2% |
| Egyptians | 97.8 /100 | #76 | Exceptional 80.2% |