French Canadian vs Immigrants from the Azores In Labor Force | Age 20-64
COMPARE
French Canadian
Immigrants from the Azores
In Labor Force | Age 20-64
In Labor Force | Age 20-64 Comparison
French Canadians
Immigrants from the Azores
79.2%
IN LABOR FORCE | AGE 20-64
8.4/ 100
METRIC RATING
219th/ 347
METRIC RANK
77.8%
IN LABOR FORCE | AGE 20-64
0.0/ 100
METRIC RATING
292nd/ 347
METRIC RANK
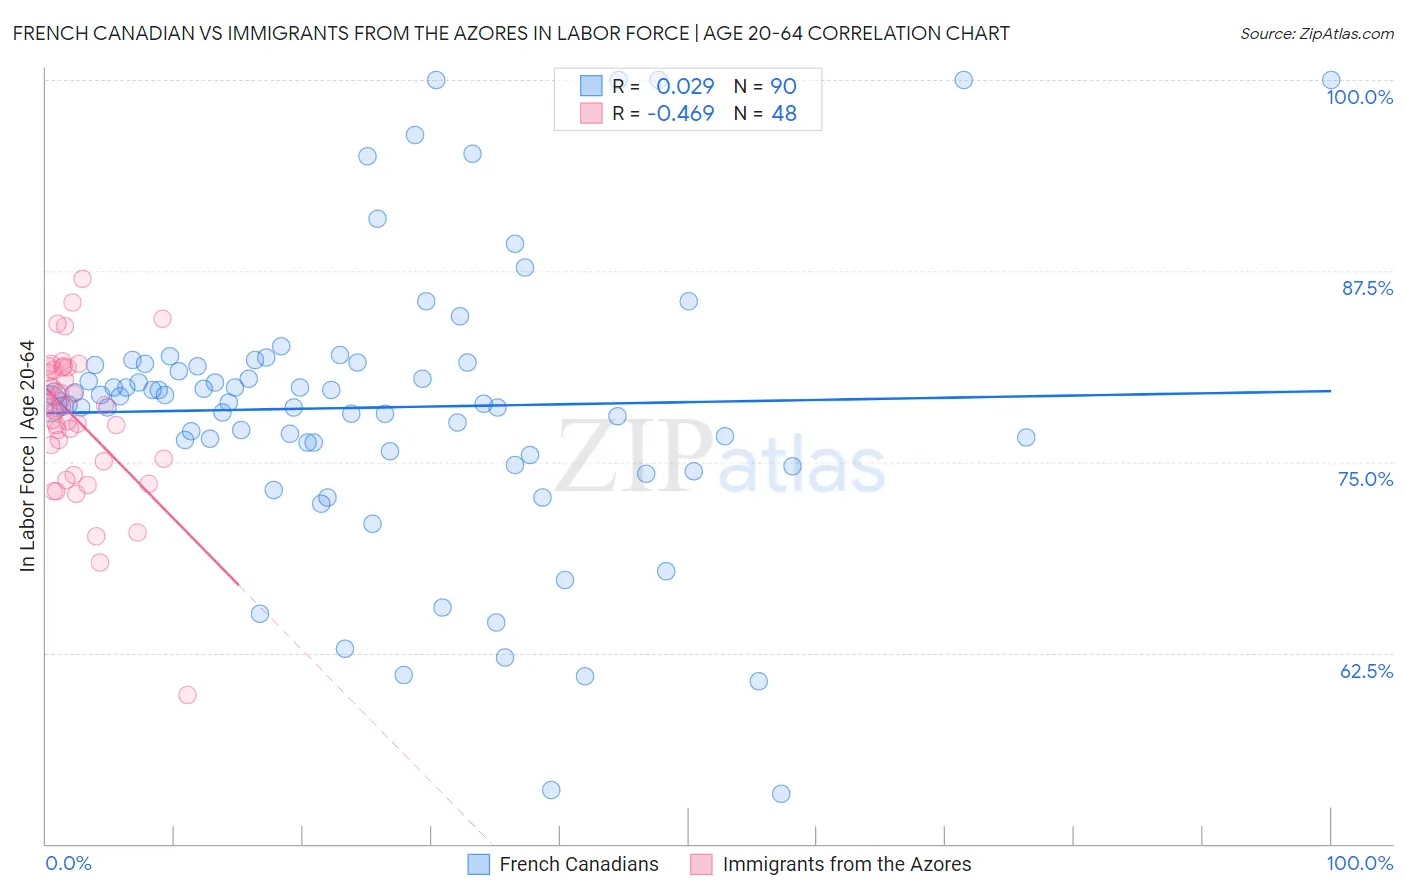
French Canadian vs Immigrants from the Azores In Labor Force | Age 20-64 Correlation Chart
The statistical analysis conducted on geographies consisting of 502,678,468 people shows no correlation between the proportion of French Canadians and labor force participation rate among population between the ages 20 and 64 in the United States with a correlation coefficient (R) of 0.029 and weighted average of 79.2%. Similarly, the statistical analysis conducted on geographies consisting of 46,256,974 people shows a moderate negative correlation between the proportion of Immigrants from the Azores and labor force participation rate among population between the ages 20 and 64 in the United States with a correlation coefficient (R) of -0.469 and weighted average of 77.8%, a difference of 1.8%.
In Labor Force | Age 20-64 Correlation Summary
| Measurement | French Canadian | Immigrants from the Azores |
| Minimum | 53.3% | 59.7% |
| Maximum | 100.0% | 87.0% |
| Range | 46.7% | 27.3% |
| Mean | 78.6% | 77.8% |
| Median | 78.8% | 78.6% |
| Interquartile 25% (IQ1) | 75.7% | 75.1% |
| Interquartile 75% (IQ3) | 81.4% | 81.1% |
| Interquartile Range (IQR) | 5.7% | 6.0% |
| Standard Deviation (Sample) | 9.3% | 4.8% |
| Standard Deviation (Population) | 9.2% | 4.8% |
Similar Demographics by In Labor Force | Age 20-64
Demographics Similar to French Canadians by In Labor Force | Age 20-64
In terms of in labor force | age 20-64, the demographic groups most similar to French Canadians are Immigrants from England (79.2%, a difference of 0.020%), Immigrants (79.2%, a difference of 0.020%), Hungarian (79.2%, a difference of 0.030%), Immigrants from Panama (79.1%, a difference of 0.040%), and Canadian (79.1%, a difference of 0.040%).
| Demographics | Rating | Rank | In Labor Force | Age 20-64 |
| Irish | 13.2 /100 | #212 | Poor 79.3% |
| Immigrants | Portugal | 12.8 /100 | #213 | Poor 79.3% |
| Immigrants | Armenia | 12.2 /100 | #214 | Poor 79.2% |
| Immigrants | Norway | 12.0 /100 | #215 | Poor 79.2% |
| Arabs | 11.4 /100 | #216 | Poor 79.2% |
| Immigrants | Western Asia | 11.0 /100 | #217 | Poor 79.2% |
| Immigrants | England | 9.3 /100 | #218 | Tragic 79.2% |
| French Canadians | 8.4 /100 | #219 | Tragic 79.2% |
| Immigrants | Immigrants | 7.7 /100 | #220 | Tragic 79.2% |
| Hungarians | 7.2 /100 | #221 | Tragic 79.2% |
| Immigrants | Panama | 6.9 /100 | #222 | Tragic 79.1% |
| Canadians | 6.8 /100 | #223 | Tragic 79.1% |
| Immigrants | Uzbekistan | 6.8 /100 | #224 | Tragic 79.1% |
| Portuguese | 6.4 /100 | #225 | Tragic 79.1% |
| Central Americans | 5.9 /100 | #226 | Tragic 79.1% |
Demographics Similar to Immigrants from the Azores by In Labor Force | Age 20-64
In terms of in labor force | age 20-64, the demographic groups most similar to Immigrants from the Azores are Delaware (77.8%, a difference of 0.040%), Spanish American (77.8%, a difference of 0.050%), Immigrants from Bangladesh (77.9%, a difference of 0.10%), African (77.9%, a difference of 0.12%), and Immigrants from Central America (77.7%, a difference of 0.12%).
| Demographics | Rating | Rank | In Labor Force | Age 20-64 |
| Osage | 0.0 /100 | #285 | Tragic 78.0% |
| Immigrants | Belize | 0.0 /100 | #286 | Tragic 78.0% |
| Vietnamese | 0.0 /100 | #287 | Tragic 78.0% |
| Hmong | 0.0 /100 | #288 | Tragic 77.9% |
| Africans | 0.0 /100 | #289 | Tragic 77.9% |
| Immigrants | Bangladesh | 0.0 /100 | #290 | Tragic 77.9% |
| Spanish Americans | 0.0 /100 | #291 | Tragic 77.8% |
| Immigrants | Azores | 0.0 /100 | #292 | Tragic 77.8% |
| Delaware | 0.0 /100 | #293 | Tragic 77.8% |
| Immigrants | Central America | 0.0 /100 | #294 | Tragic 77.7% |
| Immigrants | Grenada | 0.0 /100 | #295 | Tragic 77.7% |
| Immigrants | Dominican Republic | 0.0 /100 | #296 | Tragic 77.7% |
| Dominicans | 0.0 /100 | #297 | Tragic 77.7% |
| Cree | 0.0 /100 | #298 | Tragic 77.7% |
| Hispanics or Latinos | 0.0 /100 | #299 | Tragic 77.6% |