Japanese vs Houma In Labor Force | Age 20-64
COMPARE
Japanese
Houma
In Labor Force | Age 20-64
In Labor Force | Age 20-64 Comparison
Japanese
Houma
79.1%
IN LABOR FORCE | AGE 20-64
4.0/ 100
METRIC RATING
233rd/ 347
METRIC RANK
72.7%
IN LABOR FORCE | AGE 20-64
0.0/ 100
METRIC RATING
339th/ 347
METRIC RANK
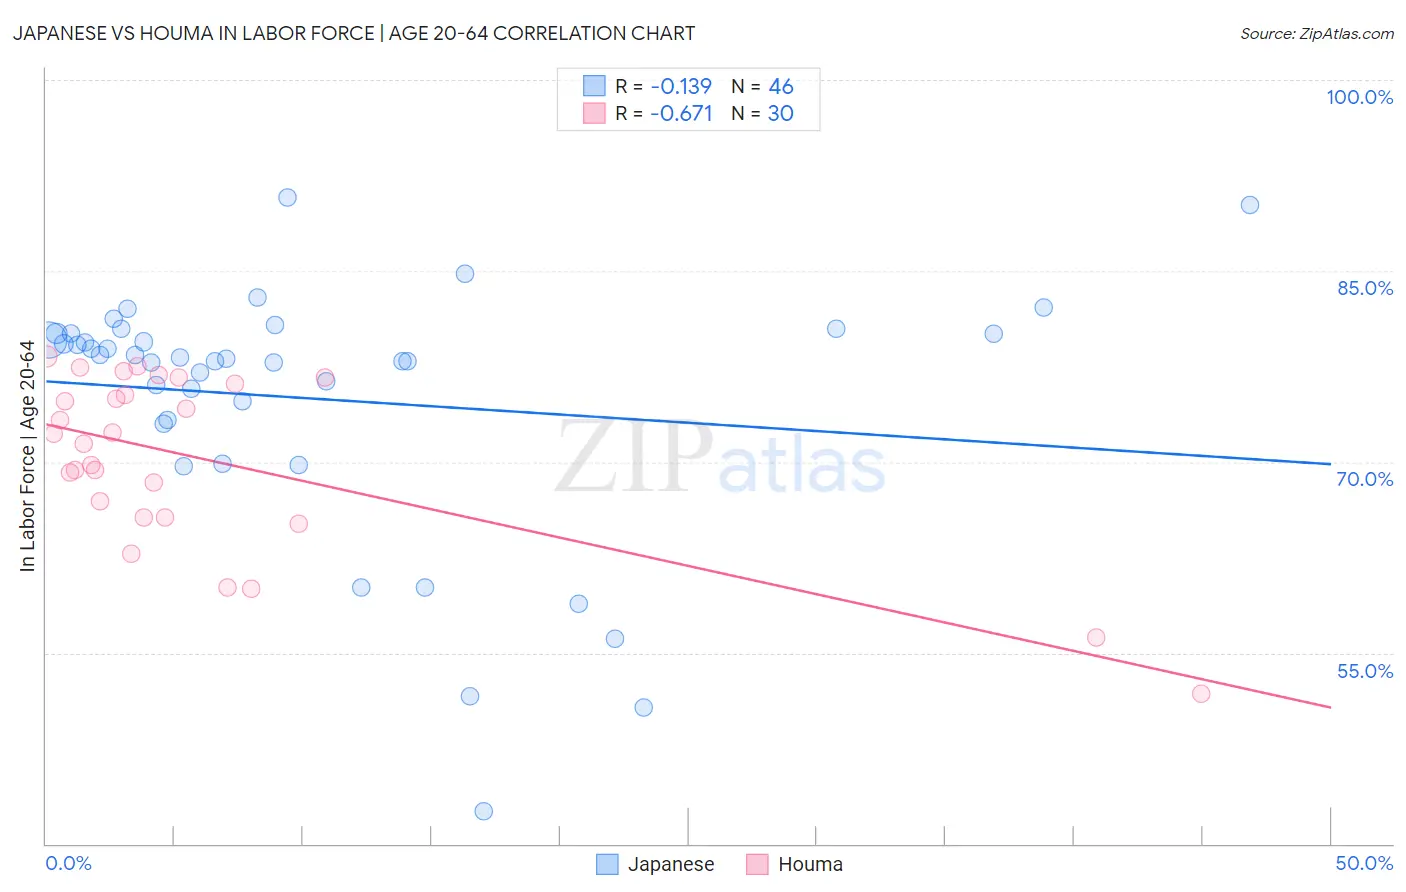
Japanese vs Houma In Labor Force | Age 20-64 Correlation Chart
The statistical analysis conducted on geographies consisting of 249,187,220 people shows a poor negative correlation between the proportion of Japanese and labor force participation rate among population between the ages 20 and 64 in the United States with a correlation coefficient (R) of -0.139 and weighted average of 79.1%. Similarly, the statistical analysis conducted on geographies consisting of 36,797,748 people shows a significant negative correlation between the proportion of Houma and labor force participation rate among population between the ages 20 and 64 in the United States with a correlation coefficient (R) of -0.671 and weighted average of 72.7%, a difference of 8.7%.
In Labor Force | Age 20-64 Correlation Summary
| Measurement | Japanese | Houma |
| Minimum | 42.6% | 51.8% |
| Maximum | 90.8% | 78.3% |
| Range | 48.2% | 26.5% |
| Mean | 75.0% | 70.2% |
| Median | 78.2% | 71.9% |
| Interquartile 25% (IQ1) | 73.3% | 65.6% |
| Interquartile 75% (IQ3) | 80.1% | 76.1% |
| Interquartile Range (IQR) | 6.8% | 10.5% |
| Standard Deviation (Sample) | 10.0% | 6.9% |
| Standard Deviation (Population) | 9.9% | 6.7% |
Similar Demographics by In Labor Force | Age 20-64
Demographics Similar to Japanese by In Labor Force | Age 20-64
In terms of in labor force | age 20-64, the demographic groups most similar to Japanese are Guamanian/Chamorro (79.1%, a difference of 0.030%), Immigrants from Canada (79.0%, a difference of 0.040%), Lebanese (79.1%, a difference of 0.050%), Tlingit-Haida (79.0%, a difference of 0.050%), and Samoan (79.0%, a difference of 0.060%).
| Demographics | Rating | Rank | In Labor Force | Age 20-64 |
| Central Americans | 5.9 /100 | #226 | Tragic 79.1% |
| Immigrants | Western Europe | 5.9 /100 | #227 | Tragic 79.1% |
| Panamanians | 5.7 /100 | #228 | Tragic 79.1% |
| Alsatians | 5.7 /100 | #229 | Tragic 79.1% |
| Native Hawaiians | 5.6 /100 | #230 | Tragic 79.1% |
| Lebanese | 5.1 /100 | #231 | Tragic 79.1% |
| Guamanians/Chamorros | 4.5 /100 | #232 | Tragic 79.1% |
| Japanese | 4.0 /100 | #233 | Tragic 79.1% |
| Immigrants | Canada | 3.2 /100 | #234 | Tragic 79.0% |
| Tlingit-Haida | 3.2 /100 | #235 | Tragic 79.0% |
| Samoans | 2.9 /100 | #236 | Tragic 79.0% |
| Immigrants | North America | 2.9 /100 | #237 | Tragic 79.0% |
| Immigrants | Jamaica | 2.6 /100 | #238 | Tragic 79.0% |
| Welsh | 2.4 /100 | #239 | Tragic 79.0% |
| Trinidadians and Tobagonians | 2.3 /100 | #240 | Tragic 79.0% |
Demographics Similar to Houma by In Labor Force | Age 20-64
In terms of in labor force | age 20-64, the demographic groups most similar to Houma are Pueblo (72.6%, a difference of 0.15%), Puerto Rican (73.1%, a difference of 0.43%), Yup'ik (73.2%, a difference of 0.64%), Immigrants from Yemen (72.3%, a difference of 0.64%), and Crow (73.3%, a difference of 0.76%).
| Demographics | Rating | Rank | In Labor Force | Age 20-64 |
| Arapaho | 0.0 /100 | #332 | Tragic 74.4% |
| Natives/Alaskans | 0.0 /100 | #333 | Tragic 73.9% |
| Apache | 0.0 /100 | #334 | Tragic 73.7% |
| Ute | 0.0 /100 | #335 | Tragic 73.7% |
| Crow | 0.0 /100 | #336 | Tragic 73.3% |
| Yup'ik | 0.0 /100 | #337 | Tragic 73.2% |
| Puerto Ricans | 0.0 /100 | #338 | Tragic 73.1% |
| Houma | 0.0 /100 | #339 | Tragic 72.7% |
| Pueblo | 0.0 /100 | #340 | Tragic 72.6% |
| Immigrants | Yemen | 0.0 /100 | #341 | Tragic 72.3% |
| Yuman | 0.0 /100 | #342 | Tragic 71.7% |
| Hopi | 0.0 /100 | #343 | Tragic 71.7% |
| Lumbee | 0.0 /100 | #344 | Tragic 70.6% |
| Tohono O'odham | 0.0 /100 | #345 | Tragic 70.4% |
| Navajo | 0.0 /100 | #346 | Tragic 69.2% |