Immigrants from Haiti vs Immigrants from the Azores In Labor Force | Age 20-64
COMPARE
Immigrants from Haiti
Immigrants from the Azores
In Labor Force | Age 20-64
In Labor Force | Age 20-64 Comparison
Immigrants from Haiti
Immigrants from the Azores
79.4%
IN LABOR FORCE | AGE 20-64
32.1/ 100
METRIC RATING
188th/ 347
METRIC RANK
77.8%
IN LABOR FORCE | AGE 20-64
0.0/ 100
METRIC RATING
292nd/ 347
METRIC RANK
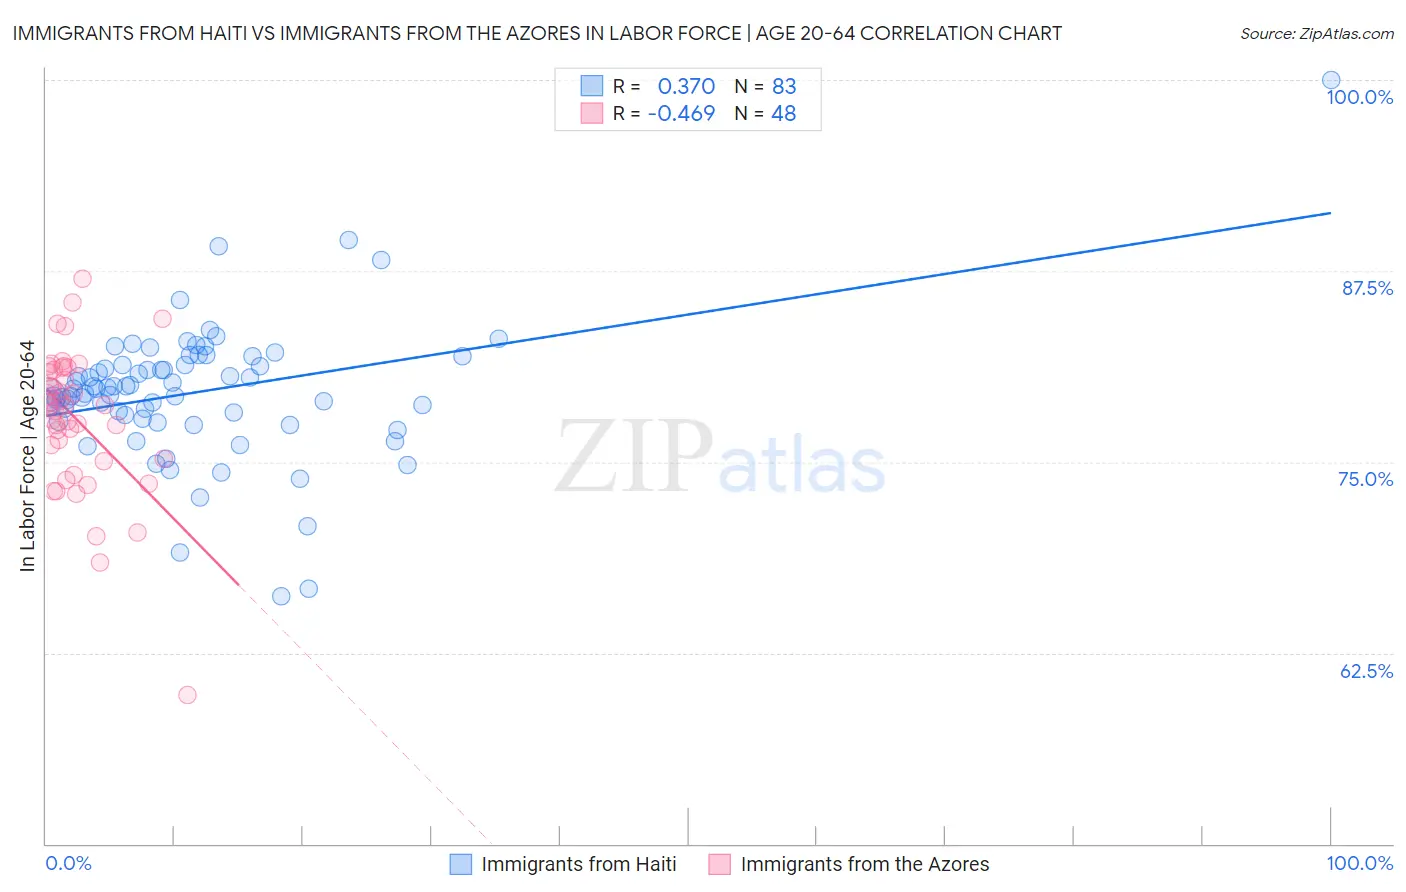
Immigrants from Haiti vs Immigrants from the Azores In Labor Force | Age 20-64 Correlation Chart
The statistical analysis conducted on geographies consisting of 225,284,201 people shows a mild positive correlation between the proportion of Immigrants from Haiti and labor force participation rate among population between the ages 20 and 64 in the United States with a correlation coefficient (R) of 0.370 and weighted average of 79.4%. Similarly, the statistical analysis conducted on geographies consisting of 46,256,974 people shows a moderate negative correlation between the proportion of Immigrants from the Azores and labor force participation rate among population between the ages 20 and 64 in the United States with a correlation coefficient (R) of -0.469 and weighted average of 77.8%, a difference of 2.1%.
In Labor Force | Age 20-64 Correlation Summary
| Measurement | Immigrants from Haiti | Immigrants from the Azores |
| Minimum | 66.2% | 59.7% |
| Maximum | 100.0% | 87.0% |
| Range | 33.8% | 27.3% |
| Mean | 79.6% | 77.8% |
| Median | 79.8% | 78.6% |
| Interquartile 25% (IQ1) | 77.8% | 75.1% |
| Interquartile 75% (IQ3) | 81.4% | 81.1% |
| Interquartile Range (IQR) | 3.5% | 6.0% |
| Standard Deviation (Sample) | 4.5% | 4.8% |
| Standard Deviation (Population) | 4.5% | 4.8% |
Similar Demographics by In Labor Force | Age 20-64
Demographics Similar to Immigrants from Haiti by In Labor Force | Age 20-64
In terms of in labor force | age 20-64, the demographic groups most similar to Immigrants from Haiti are Assyrian/Chaldean/Syriac (79.4%, a difference of 0.010%), Immigrants from El Salvador (79.4%, a difference of 0.010%), Immigrants from Syria (79.4%, a difference of 0.010%), Israeli (79.5%, a difference of 0.020%), and Northern European (79.5%, a difference of 0.020%).
| Demographics | Rating | Rank | In Labor Force | Age 20-64 |
| Immigrants | Saudi Arabia | 37.7 /100 | #181 | Fair 79.5% |
| Malaysians | 37.1 /100 | #182 | Fair 79.5% |
| Immigrants | Hungary | 36.8 /100 | #183 | Fair 79.5% |
| Finns | 35.9 /100 | #184 | Fair 79.5% |
| Israelis | 34.7 /100 | #185 | Fair 79.5% |
| Northern Europeans | 34.5 /100 | #186 | Fair 79.5% |
| Assyrians/Chaldeans/Syriacs | 33.3 /100 | #187 | Fair 79.4% |
| Immigrants | Haiti | 32.1 /100 | #188 | Fair 79.4% |
| Immigrants | El Salvador | 30.9 /100 | #189 | Fair 79.4% |
| Immigrants | Syria | 30.8 /100 | #190 | Fair 79.4% |
| Swiss | 28.9 /100 | #191 | Fair 79.4% |
| Immigrants | Denmark | 26.9 /100 | #192 | Fair 79.4% |
| Indonesians | 26.1 /100 | #193 | Fair 79.4% |
| Immigrants | Thailand | 24.8 /100 | #194 | Fair 79.4% |
| Immigrants | Austria | 23.7 /100 | #195 | Fair 79.4% |
Demographics Similar to Immigrants from the Azores by In Labor Force | Age 20-64
In terms of in labor force | age 20-64, the demographic groups most similar to Immigrants from the Azores are Delaware (77.8%, a difference of 0.040%), Spanish American (77.8%, a difference of 0.050%), Immigrants from Bangladesh (77.9%, a difference of 0.10%), African (77.9%, a difference of 0.12%), and Immigrants from Central America (77.7%, a difference of 0.12%).
| Demographics | Rating | Rank | In Labor Force | Age 20-64 |
| Osage | 0.0 /100 | #285 | Tragic 78.0% |
| Immigrants | Belize | 0.0 /100 | #286 | Tragic 78.0% |
| Vietnamese | 0.0 /100 | #287 | Tragic 78.0% |
| Hmong | 0.0 /100 | #288 | Tragic 77.9% |
| Africans | 0.0 /100 | #289 | Tragic 77.9% |
| Immigrants | Bangladesh | 0.0 /100 | #290 | Tragic 77.9% |
| Spanish Americans | 0.0 /100 | #291 | Tragic 77.8% |
| Immigrants | Azores | 0.0 /100 | #292 | Tragic 77.8% |
| Delaware | 0.0 /100 | #293 | Tragic 77.8% |
| Immigrants | Central America | 0.0 /100 | #294 | Tragic 77.7% |
| Immigrants | Grenada | 0.0 /100 | #295 | Tragic 77.7% |
| Immigrants | Dominican Republic | 0.0 /100 | #296 | Tragic 77.7% |
| Dominicans | 0.0 /100 | #297 | Tragic 77.7% |
| Cree | 0.0 /100 | #298 | Tragic 77.7% |
| Hispanics or Latinos | 0.0 /100 | #299 | Tragic 77.6% |