Japanese vs Immigrants from the Azores Householder Income Under 25 years
COMPARE
Japanese
Immigrants from the Azores
Householder Income Under 25 years
Householder Income Under 25 years Comparison
Japanese
Immigrants from the Azores
$52,365
HOUSEHOLDER INCOME UNDER 25 YEARS
60.5/ 100
METRIC RATING
168th/ 347
METRIC RANK
$52,621
HOUSEHOLDER INCOME UNDER 25 YEARS
74.2/ 100
METRIC RATING
154th/ 347
METRIC RANK
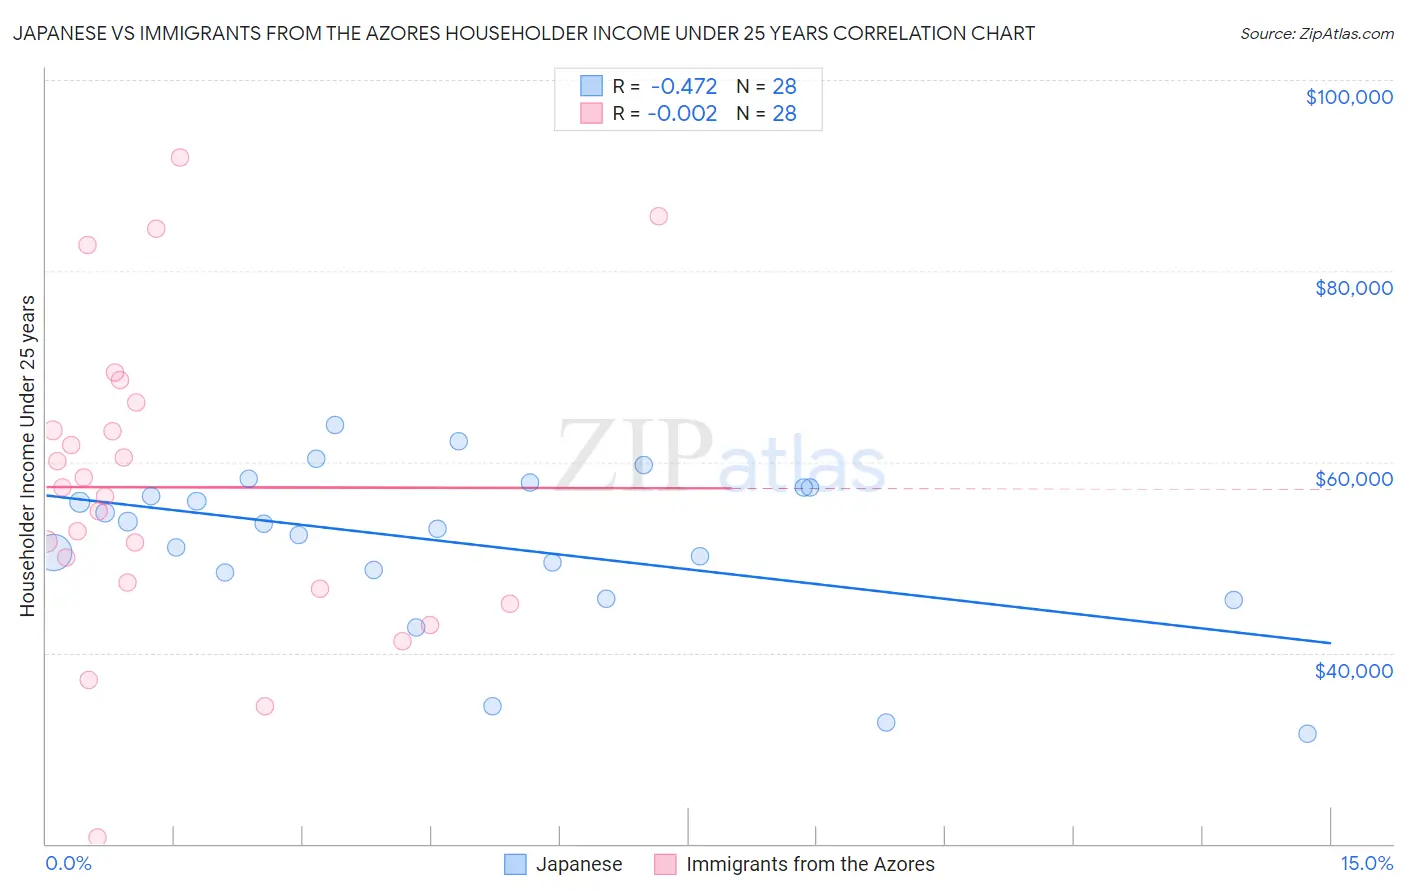
Japanese vs Immigrants from the Azores Householder Income Under 25 years Correlation Chart
The statistical analysis conducted on geographies consisting of 222,746,712 people shows a moderate negative correlation between the proportion of Japanese and household income with householder under the age of 25 in the United States with a correlation coefficient (R) of -0.472 and weighted average of $52,365. Similarly, the statistical analysis conducted on geographies consisting of 40,962,746 people shows no correlation between the proportion of Immigrants from the Azores and household income with householder under the age of 25 in the United States with a correlation coefficient (R) of -0.002 and weighted average of $52,621, a difference of 0.49%.
Householder Income Under 25 years Correlation Summary
| Measurement | Japanese | Immigrants from the Azores |
| Minimum | $31,569 | $20,652 |
| Maximum | $63,892 | $91,938 |
| Range | $32,323 | $71,286 |
| Mean | $51,521 | $57,341 |
| Median | $53,255 | $56,819 |
| Interquartile 25% (IQ1) | $48,512 | $46,997 |
| Interquartile 75% (IQ3) | $57,313 | $64,729 |
| Interquartile Range (IQR) | $8,801 | $17,732 |
| Standard Deviation (Sample) | $8,318 | $16,204 |
| Standard Deviation (Population) | $8,169 | $15,912 |
Demographics Similar to Japanese and Immigrants from the Azores by Householder Income Under 25 years
In terms of householder income under 25 years, the demographic groups most similar to Japanese are Immigrants from Uganda ($52,374, a difference of 0.020%), Canadian ($52,336, a difference of 0.060%), Israeli ($52,335, a difference of 0.060%), Immigrants from Austria ($52,400, a difference of 0.070%), and Polish ($52,407, a difference of 0.080%). Similarly, the demographic groups most similar to Immigrants from the Azores are Central American ($52,626, a difference of 0.010%), Trinidadian and Tobagonian ($52,631, a difference of 0.020%), Immigrants from Denmark ($52,612, a difference of 0.020%), Immigrants from Nepal ($52,611, a difference of 0.020%), and Immigrants from Scotland ($52,638, a difference of 0.030%).
| Demographics | Rating | Rank | Householder Income Under 25 years |
| Immigrants | Scotland | 75.0 /100 | #151 | Good $52,638 |
| Trinidadians and Tobagonians | 74.6 /100 | #152 | Good $52,631 |
| Central Americans | 74.4 /100 | #153 | Good $52,626 |
| Immigrants | Azores | 74.2 /100 | #154 | Good $52,621 |
| Immigrants | Denmark | 73.8 /100 | #155 | Good $52,612 |
| Immigrants | Nepal | 73.7 /100 | #156 | Good $52,611 |
| Ghanaians | 72.9 /100 | #157 | Good $52,594 |
| Immigrants | Netherlands | 72.8 /100 | #158 | Good $52,592 |
| Mongolians | 70.2 /100 | #159 | Good $52,540 |
| Immigrants | Turkey | 68.3 /100 | #160 | Good $52,503 |
| Uruguayans | 66.2 /100 | #161 | Good $52,465 |
| Immigrants | Cambodia | 65.4 /100 | #162 | Good $52,450 |
| Immigrants | Chile | 64.8 /100 | #163 | Good $52,440 |
| Immigrants | Trinidad and Tobago | 64.7 /100 | #164 | Good $52,437 |
| Poles | 63.0 /100 | #165 | Good $52,407 |
| Immigrants | Austria | 62.6 /100 | #166 | Good $52,400 |
| Immigrants | Uganda | 61.1 /100 | #167 | Good $52,374 |
| Japanese | 60.5 /100 | #168 | Good $52,365 |
| Canadians | 58.8 /100 | #169 | Average $52,336 |
| Israelis | 58.8 /100 | #170 | Average $52,335 |
| Immigrants | Uruguay | 56.8 /100 | #171 | Average $52,302 |