Israeli vs Immigrants from Africa In Labor Force | Age > 16
COMPARE
Israeli
Immigrants from Africa
In Labor Force | Age > 16
In Labor Force | Age > 16 Comparison
Israelis
Immigrants from Africa
65.2%
IN LABOR FORCE | AGE > 16
61.6/ 100
METRIC RATING
171st/ 347
METRIC RANK
67.4%
IN LABOR FORCE | AGE > 16
100.0/ 100
METRIC RATING
25th/ 347
METRIC RANK
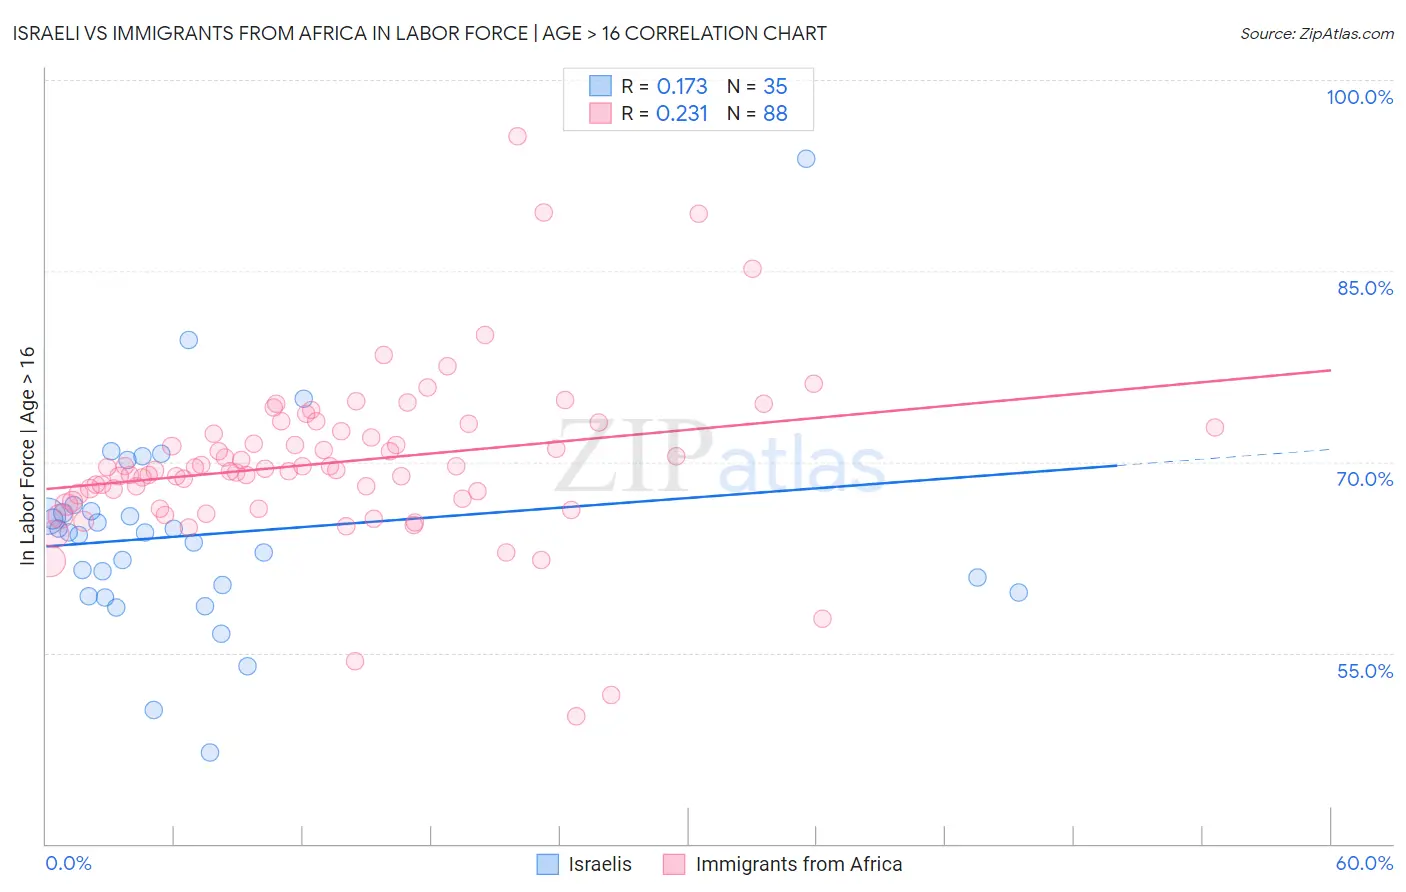
Israeli vs Immigrants from Africa In Labor Force | Age > 16 Correlation Chart
The statistical analysis conducted on geographies consisting of 211,218,768 people shows a poor positive correlation between the proportion of Israelis and labor force participation rate among population ages 16 and over in the United States with a correlation coefficient (R) of 0.173 and weighted average of 65.2%. Similarly, the statistical analysis conducted on geographies consisting of 469,450,082 people shows a weak positive correlation between the proportion of Immigrants from Africa and labor force participation rate among population ages 16 and over in the United States with a correlation coefficient (R) of 0.231 and weighted average of 67.4%, a difference of 3.3%.
In Labor Force | Age > 16 Correlation Summary
| Measurement | Israeli | Immigrants from Africa |
| Minimum | 47.2% | 50.0% |
| Maximum | 93.8% | 95.6% |
| Range | 46.6% | 45.6% |
| Mean | 64.3% | 70.0% |
| Median | 64.4% | 69.4% |
| Interquartile 25% (IQ1) | 59.7% | 67.0% |
| Interquartile 75% (IQ3) | 66.1% | 72.6% |
| Interquartile Range (IQR) | 6.4% | 5.5% |
| Standard Deviation (Sample) | 8.1% | 6.6% |
| Standard Deviation (Population) | 8.0% | 6.6% |
Similar Demographics by In Labor Force | Age > 16
Demographics Similar to Israelis by In Labor Force | Age > 16
In terms of in labor force | age > 16, the demographic groups most similar to Israelis are Immigrants from Israel (65.2%, a difference of 0.0%), Immigrants from Sweden (65.2%, a difference of 0.0%), Arab (65.2%, a difference of 0.010%), Serbian (65.2%, a difference of 0.020%), and Immigrants from Belarus (65.2%, a difference of 0.050%).
| Demographics | Rating | Rank | In Labor Force | Age > 16 |
| Danes | 68.8 /100 | #164 | Good 65.3% |
| Immigrants | Kazakhstan | 68.1 /100 | #165 | Good 65.3% |
| Immigrants | Western Asia | 67.3 /100 | #166 | Good 65.3% |
| Immigrants | Belarus | 66.0 /100 | #167 | Good 65.2% |
| Serbians | 63.5 /100 | #168 | Good 65.2% |
| Arabs | 62.4 /100 | #169 | Good 65.2% |
| Immigrants | Israel | 61.7 /100 | #170 | Good 65.2% |
| Israelis | 61.6 /100 | #171 | Good 65.2% |
| Immigrants | Sweden | 61.3 /100 | #172 | Good 65.2% |
| Immigrants | Ukraine | 53.7 /100 | #173 | Average 65.1% |
| Macedonians | 50.0 /100 | #174 | Average 65.1% |
| Nicaraguans | 49.7 /100 | #175 | Average 65.1% |
| Swedes | 47.4 /100 | #176 | Average 65.1% |
| Eastern Europeans | 46.2 /100 | #177 | Average 65.1% |
| Trinidadians and Tobagonians | 45.2 /100 | #178 | Average 65.1% |
Demographics Similar to Immigrants from Africa by In Labor Force | Age > 16
In terms of in labor force | age > 16, the demographic groups most similar to Immigrants from Africa are Ugandan (67.4%, a difference of 0.030%), Immigrants from Cabo Verde (67.3%, a difference of 0.030%), Cambodian (67.4%, a difference of 0.090%), Zimbabwean (67.3%, a difference of 0.11%), and Immigrants from Morocco (67.2%, a difference of 0.19%).
| Demographics | Rating | Rank | In Labor Force | Age > 16 |
| Immigrants | Liberia | 100.0 /100 | #18 | Exceptional 67.6% |
| Kenyans | 100.0 /100 | #19 | Exceptional 67.6% |
| Immigrants | Kenya | 100.0 /100 | #20 | Exceptional 67.6% |
| Tongans | 100.0 /100 | #21 | Exceptional 67.5% |
| Immigrants | Uganda | 100.0 /100 | #22 | Exceptional 67.5% |
| Cambodians | 100.0 /100 | #23 | Exceptional 67.4% |
| Ugandans | 100.0 /100 | #24 | Exceptional 67.4% |
| Immigrants | Africa | 100.0 /100 | #25 | Exceptional 67.4% |
| Immigrants | Cabo Verde | 100.0 /100 | #26 | Exceptional 67.3% |
| Zimbabweans | 100.0 /100 | #27 | Exceptional 67.3% |
| Immigrants | Morocco | 100.0 /100 | #28 | Exceptional 67.2% |
| Thais | 100.0 /100 | #29 | Exceptional 67.2% |
| Immigrants | Zaire | 100.0 /100 | #30 | Exceptional 67.2% |
| Ghanaians | 100.0 /100 | #31 | Exceptional 67.1% |
| Immigrants | Congo | 100.0 /100 | #32 | Exceptional 67.1% |