Iroquois vs Immigrants from Japan In Labor Force | Age 35-44
COMPARE
Iroquois
Immigrants from Japan
In Labor Force | Age 35-44
In Labor Force | Age 35-44 Comparison
Iroquois
Immigrants from Japan
83.5%
IN LABOR FORCE | AGE 35-44
0.2/ 100
METRIC RATING
263rd/ 347
METRIC RANK
84.6%
IN LABOR FORCE | AGE 35-44
81.4/ 100
METRIC RATING
140th/ 347
METRIC RANK
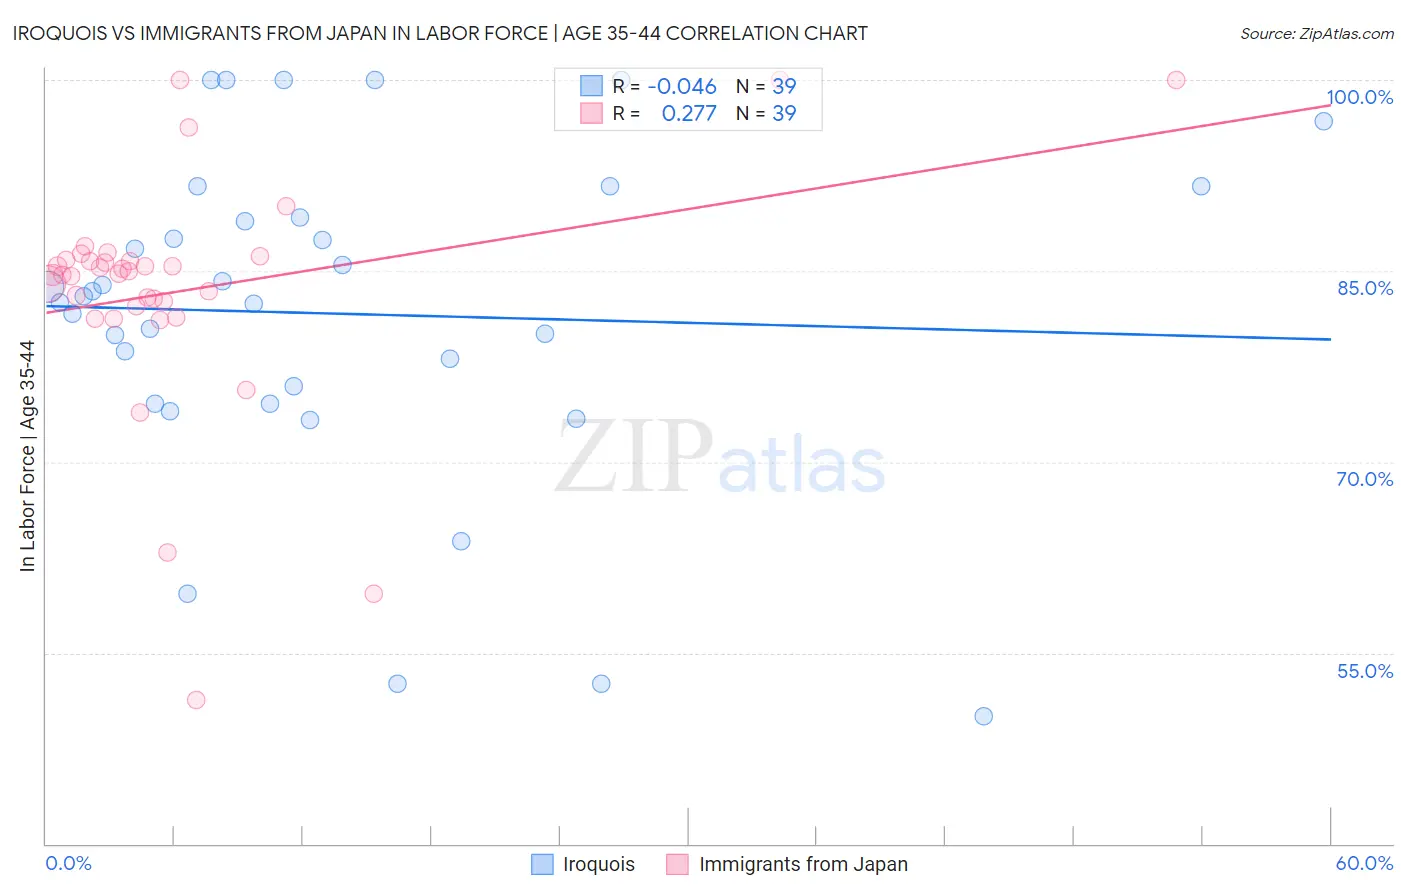
Iroquois vs Immigrants from Japan In Labor Force | Age 35-44 Correlation Chart
The statistical analysis conducted on geographies consisting of 207,246,504 people shows no correlation between the proportion of Iroquois and labor force participation rate among population between the ages 35 and 44 in the United States with a correlation coefficient (R) of -0.046 and weighted average of 83.5%. Similarly, the statistical analysis conducted on geographies consisting of 340,027,391 people shows a weak positive correlation between the proportion of Immigrants from Japan and labor force participation rate among population between the ages 35 and 44 in the United States with a correlation coefficient (R) of 0.277 and weighted average of 84.6%, a difference of 1.3%.
In Labor Force | Age 35-44 Correlation Summary
| Measurement | Iroquois | Immigrants from Japan |
| Minimum | 50.0% | 51.3% |
| Maximum | 100.0% | 100.0% |
| Range | 50.0% | 48.7% |
| Mean | 81.6% | 83.5% |
| Median | 83.1% | 84.7% |
| Interquartile 25% (IQ1) | 74.6% | 82.3% |
| Interquartile 75% (IQ3) | 89.2% | 85.9% |
| Interquartile Range (IQR) | 14.6% | 3.6% |
| Standard Deviation (Sample) | 12.9% | 9.3% |
| Standard Deviation (Population) | 12.7% | 9.2% |
Similar Demographics by In Labor Force | Age 35-44
Demographics Similar to Iroquois by In Labor Force | Age 35-44
In terms of in labor force | age 35-44, the demographic groups most similar to Iroquois are Immigrants from Dominica (83.5%, a difference of 0.030%), Immigrants from Congo (83.5%, a difference of 0.030%), Scotch-Irish (83.5%, a difference of 0.030%), Vietnamese (83.5%, a difference of 0.040%), and Central American (83.5%, a difference of 0.040%).
| Demographics | Rating | Rank | In Labor Force | Age 35-44 |
| Japanese | 0.3 /100 | #256 | Tragic 83.6% |
| Basques | 0.3 /100 | #257 | Tragic 83.6% |
| Tsimshian | 0.2 /100 | #258 | Tragic 83.5% |
| Immigrants | El Salvador | 0.2 /100 | #259 | Tragic 83.5% |
| Vietnamese | 0.2 /100 | #260 | Tragic 83.5% |
| Immigrants | Dominica | 0.2 /100 | #261 | Tragic 83.5% |
| Immigrants | Congo | 0.2 /100 | #262 | Tragic 83.5% |
| Iroquois | 0.2 /100 | #263 | Tragic 83.5% |
| Scotch-Irish | 0.1 /100 | #264 | Tragic 83.5% |
| Central Americans | 0.1 /100 | #265 | Tragic 83.5% |
| Spaniards | 0.1 /100 | #266 | Tragic 83.4% |
| Guamanians/Chamorros | 0.1 /100 | #267 | Tragic 83.4% |
| Hondurans | 0.1 /100 | #268 | Tragic 83.4% |
| Immigrants | Grenada | 0.1 /100 | #269 | Tragic 83.3% |
| Immigrants | Honduras | 0.0 /100 | #270 | Tragic 83.3% |
Demographics Similar to Immigrants from Japan by In Labor Force | Age 35-44
In terms of in labor force | age 35-44, the demographic groups most similar to Immigrants from Japan are Czechoslovakian (84.6%, a difference of 0.010%), Immigrants from Zaire (84.6%, a difference of 0.010%), Immigrants from Belgium (84.6%, a difference of 0.010%), Immigrants from Uruguay (84.6%, a difference of 0.010%), and Immigrants from Ukraine (84.6%, a difference of 0.020%).
| Demographics | Rating | Rank | In Labor Force | Age 35-44 |
| Argentineans | 88.4 /100 | #133 | Excellent 84.6% |
| Immigrants | Korea | 88.2 /100 | #134 | Excellent 84.6% |
| Immigrants | Malaysia | 87.5 /100 | #135 | Excellent 84.6% |
| Afghans | 86.3 /100 | #136 | Excellent 84.6% |
| Immigrants | Chile | 84.6 /100 | #137 | Excellent 84.6% |
| Czechoslovakians | 82.6 /100 | #138 | Excellent 84.6% |
| Immigrants | Zaire | 82.5 /100 | #139 | Excellent 84.6% |
| Immigrants | Japan | 81.4 /100 | #140 | Excellent 84.6% |
| Immigrants | Belgium | 80.8 /100 | #141 | Excellent 84.6% |
| Immigrants | Uruguay | 80.1 /100 | #142 | Excellent 84.6% |
| Immigrants | Ukraine | 79.7 /100 | #143 | Good 84.6% |
| Immigrants | Jamaica | 79.4 /100 | #144 | Good 84.6% |
| Immigrants | Saudi Arabia | 79.4 /100 | #145 | Good 84.6% |
| Immigrants | Asia | 78.7 /100 | #146 | Good 84.5% |
| Immigrants | Netherlands | 76.6 /100 | #147 | Good 84.5% |