Iroquois vs Asian In Labor Force | Age 35-44
COMPARE
Iroquois
Asian
In Labor Force | Age 35-44
In Labor Force | Age 35-44 Comparison
Iroquois
Asians
83.5%
IN LABOR FORCE | AGE 35-44
0.2/ 100
METRIC RATING
263rd/ 347
METRIC RANK
84.7%
IN LABOR FORCE | AGE 35-44
90.6/ 100
METRIC RATING
126th/ 347
METRIC RANK
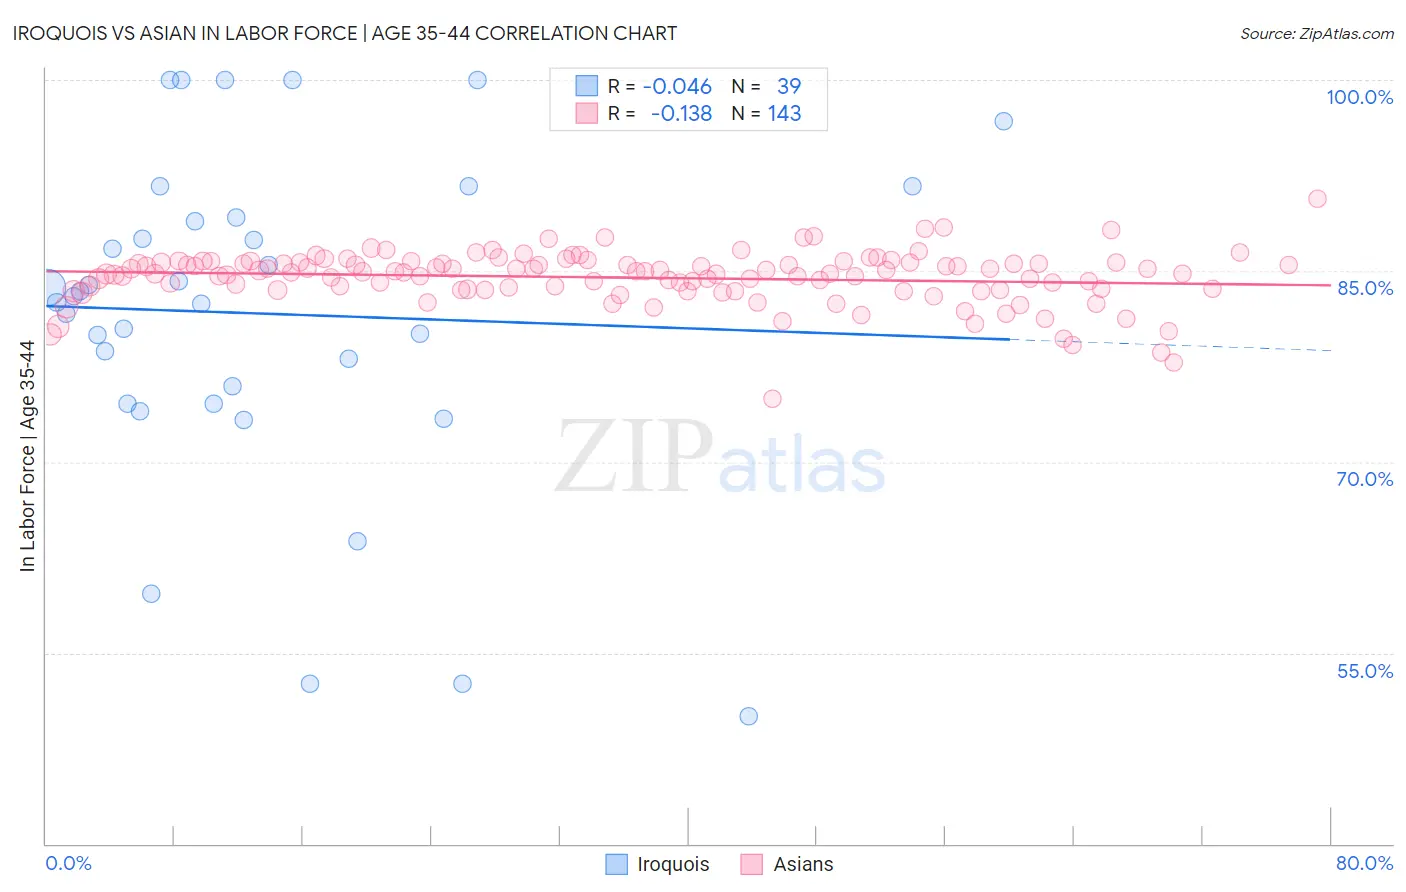
Iroquois vs Asian In Labor Force | Age 35-44 Correlation Chart
The statistical analysis conducted on geographies consisting of 207,246,504 people shows no correlation between the proportion of Iroquois and labor force participation rate among population between the ages 35 and 44 in the United States with a correlation coefficient (R) of -0.046 and weighted average of 83.5%. Similarly, the statistical analysis conducted on geographies consisting of 550,310,951 people shows a poor negative correlation between the proportion of Asians and labor force participation rate among population between the ages 35 and 44 in the United States with a correlation coefficient (R) of -0.138 and weighted average of 84.7%, a difference of 1.4%.
In Labor Force | Age 35-44 Correlation Summary
| Measurement | Iroquois | Asian |
| Minimum | 50.0% | 74.9% |
| Maximum | 100.0% | 90.7% |
| Range | 50.0% | 15.8% |
| Mean | 81.6% | 84.5% |
| Median | 83.1% | 84.9% |
| Interquartile 25% (IQ1) | 74.6% | 83.5% |
| Interquartile 75% (IQ3) | 89.2% | 85.6% |
| Interquartile Range (IQR) | 14.6% | 2.1% |
| Standard Deviation (Sample) | 12.9% | 2.1% |
| Standard Deviation (Population) | 12.7% | 2.1% |
Similar Demographics by In Labor Force | Age 35-44
Demographics Similar to Iroquois by In Labor Force | Age 35-44
In terms of in labor force | age 35-44, the demographic groups most similar to Iroquois are Immigrants from Dominica (83.5%, a difference of 0.030%), Immigrants from Congo (83.5%, a difference of 0.030%), Scotch-Irish (83.5%, a difference of 0.030%), Vietnamese (83.5%, a difference of 0.040%), and Central American (83.5%, a difference of 0.040%).
| Demographics | Rating | Rank | In Labor Force | Age 35-44 |
| Japanese | 0.3 /100 | #256 | Tragic 83.6% |
| Basques | 0.3 /100 | #257 | Tragic 83.6% |
| Tsimshian | 0.2 /100 | #258 | Tragic 83.5% |
| Immigrants | El Salvador | 0.2 /100 | #259 | Tragic 83.5% |
| Vietnamese | 0.2 /100 | #260 | Tragic 83.5% |
| Immigrants | Dominica | 0.2 /100 | #261 | Tragic 83.5% |
| Immigrants | Congo | 0.2 /100 | #262 | Tragic 83.5% |
| Iroquois | 0.2 /100 | #263 | Tragic 83.5% |
| Scotch-Irish | 0.1 /100 | #264 | Tragic 83.5% |
| Central Americans | 0.1 /100 | #265 | Tragic 83.5% |
| Spaniards | 0.1 /100 | #266 | Tragic 83.4% |
| Guamanians/Chamorros | 0.1 /100 | #267 | Tragic 83.4% |
| Hondurans | 0.1 /100 | #268 | Tragic 83.4% |
| Immigrants | Grenada | 0.1 /100 | #269 | Tragic 83.3% |
| Immigrants | Honduras | 0.0 /100 | #270 | Tragic 83.3% |
Demographics Similar to Asians by In Labor Force | Age 35-44
In terms of in labor force | age 35-44, the demographic groups most similar to Asians are Slavic (84.7%, a difference of 0.0%), Maltese (84.7%, a difference of 0.0%), Immigrants from Spain (84.7%, a difference of 0.0%), Immigrants from Ghana (84.7%, a difference of 0.0%), and Finnish (84.7%, a difference of 0.010%).
| Demographics | Rating | Rank | In Labor Force | Age 35-44 |
| Burmese | 91.8 /100 | #119 | Exceptional 84.7% |
| Immigrants | Northern Europe | 91.5 /100 | #120 | Exceptional 84.7% |
| Finns | 91.2 /100 | #121 | Exceptional 84.7% |
| Germans | 91.0 /100 | #122 | Exceptional 84.7% |
| Immigrants | South America | 90.9 /100 | #123 | Exceptional 84.7% |
| Slavs | 90.8 /100 | #124 | Exceptional 84.7% |
| Maltese | 90.8 /100 | #125 | Exceptional 84.7% |
| Asians | 90.6 /100 | #126 | Exceptional 84.7% |
| Immigrants | Spain | 90.6 /100 | #127 | Exceptional 84.7% |
| Immigrants | Ghana | 90.4 /100 | #128 | Exceptional 84.7% |
| Palestinians | 89.7 /100 | #129 | Excellent 84.7% |
| Bhutanese | 89.7 /100 | #130 | Excellent 84.7% |
| Immigrants | Scotland | 89.6 /100 | #131 | Excellent 84.7% |
| Austrians | 89.4 /100 | #132 | Excellent 84.7% |
| Argentineans | 88.4 /100 | #133 | Excellent 84.6% |