Iroquois vs Central American Associate's Degree
COMPARE
Iroquois
Central American
Associate's Degree
Associate's Degree Comparison
Iroquois
Central Americans
42.8%
ASSOCIATE'S DEGREE
1.7/ 100
METRIC RATING
238th/ 347
METRIC RANK
39.4%
ASSOCIATE'S DEGREE
0.0/ 100
METRIC RATING
289th/ 347
METRIC RANK
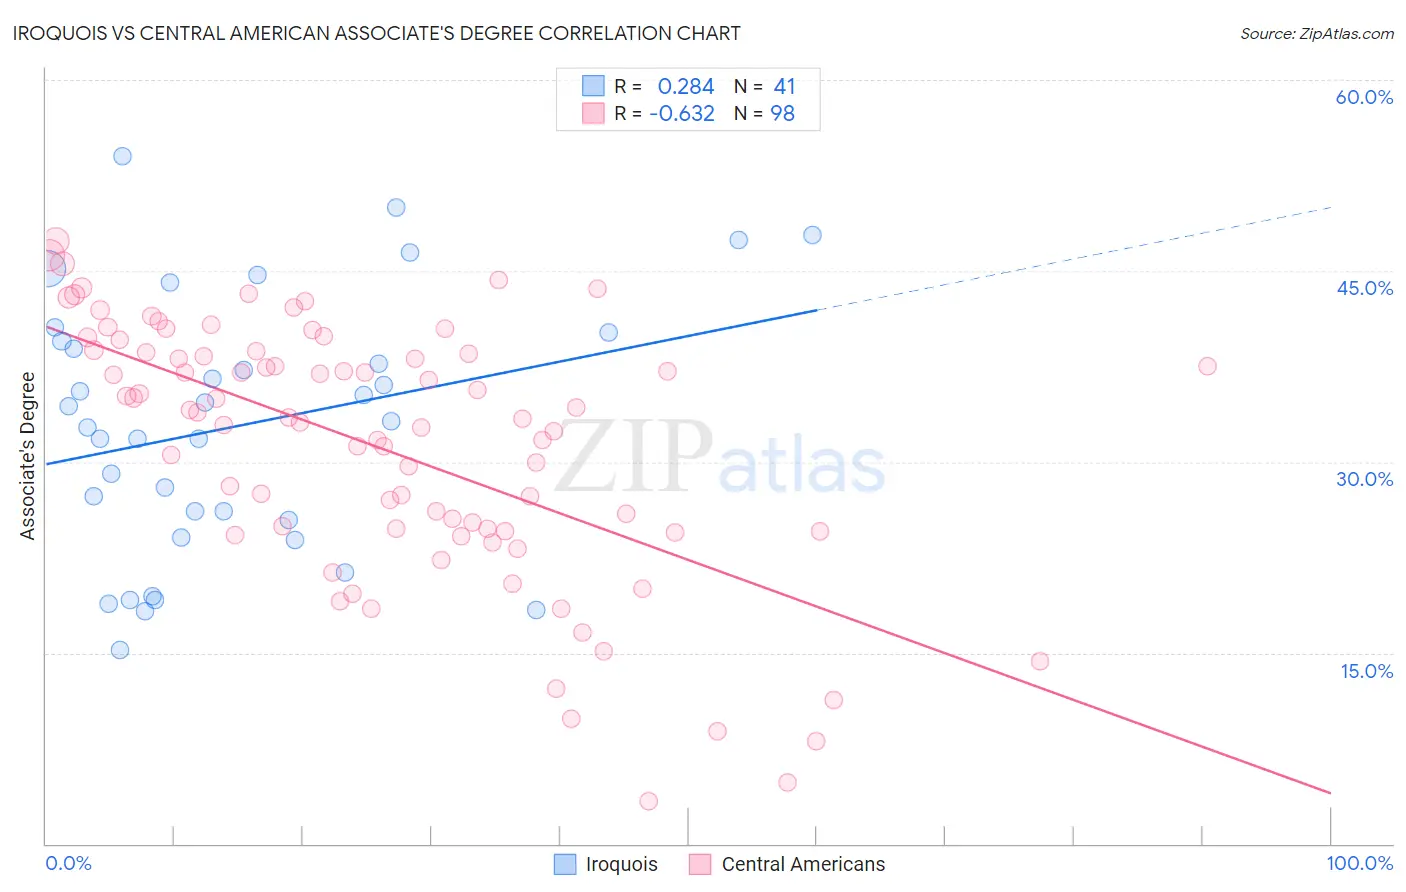
Iroquois vs Central American Associate's Degree Correlation Chart
The statistical analysis conducted on geographies consisting of 207,308,228 people shows a weak positive correlation between the proportion of Iroquois and percentage of population with at least associate's degree education in the United States with a correlation coefficient (R) of 0.284 and weighted average of 42.8%. Similarly, the statistical analysis conducted on geographies consisting of 504,559,402 people shows a significant negative correlation between the proportion of Central Americans and percentage of population with at least associate's degree education in the United States with a correlation coefficient (R) of -0.632 and weighted average of 39.4%, a difference of 8.6%.
Associate's Degree Correlation Summary
| Measurement | Iroquois | Central American |
| Minimum | 15.2% | 3.3% |
| Maximum | 54.0% | 47.4% |
| Range | 38.7% | 44.0% |
| Mean | 32.9% | 31.1% |
| Median | 33.2% | 33.4% |
| Interquartile 25% (IQ1) | 24.8% | 24.6% |
| Interquartile 75% (IQ3) | 39.9% | 38.6% |
| Interquartile Range (IQR) | 15.1% | 14.0% |
| Standard Deviation (Sample) | 10.1% | 10.1% |
| Standard Deviation (Population) | 9.9% | 10.0% |
Similar Demographics by Associate's Degree
Demographics Similar to Iroquois by Associate's Degree
In terms of associate's degree, the demographic groups most similar to Iroquois are Nonimmigrants (42.9%, a difference of 0.26%), Immigrants from St. Vincent and the Grenadines (42.9%, a difference of 0.28%), Ecuadorian (43.0%, a difference of 0.36%), Tlingit-Haida (43.0%, a difference of 0.45%), and Immigrants from Grenada (42.6%, a difference of 0.51%).
| Demographics | Rating | Rank | Associate's Degree |
| Liberians | 2.9 /100 | #231 | Tragic 43.3% |
| Native Hawaiians | 2.3 /100 | #232 | Tragic 43.1% |
| Tongans | 2.2 /100 | #233 | Tragic 43.0% |
| Tlingit-Haida | 2.1 /100 | #234 | Tragic 43.0% |
| Ecuadorians | 2.0 /100 | #235 | Tragic 43.0% |
| Immigrants | St. Vincent and the Grenadines | 1.9 /100 | #236 | Tragic 42.9% |
| Immigrants | Nonimmigrants | 1.9 /100 | #237 | Tragic 42.9% |
| Iroquois | 1.7 /100 | #238 | Tragic 42.8% |
| Immigrants | Grenada | 1.3 /100 | #239 | Tragic 42.6% |
| Cree | 1.2 /100 | #240 | Tragic 42.5% |
| British West Indians | 1.0 /100 | #241 | Tragic 42.4% |
| Immigrants | West Indies | 1.0 /100 | #242 | Tragic 42.4% |
| Guyanese | 1.0 /100 | #243 | Tragic 42.3% |
| Immigrants | Liberia | 0.9 /100 | #244 | Tragic 42.3% |
| Immigrants | Cambodia | 0.9 /100 | #245 | Tragic 42.3% |
Demographics Similar to Central Americans by Associate's Degree
In terms of associate's degree, the demographic groups most similar to Central Americans are Immigrants from Cuba (39.5%, a difference of 0.26%), Immigrants from Haiti (39.3%, a difference of 0.44%), Dominican (39.3%, a difference of 0.46%), Aleut (39.6%, a difference of 0.50%), and Black/African American (39.1%, a difference of 0.75%).
| Demographics | Rating | Rank | Associate's Degree |
| Bangladeshis | 0.1 /100 | #282 | Tragic 40.0% |
| Haitians | 0.1 /100 | #283 | Tragic 40.0% |
| Comanche | 0.1 /100 | #284 | Tragic 39.9% |
| Immigrants | Belize | 0.1 /100 | #285 | Tragic 39.9% |
| Immigrants | Caribbean | 0.0 /100 | #286 | Tragic 39.7% |
| Aleuts | 0.0 /100 | #287 | Tragic 39.6% |
| Immigrants | Cuba | 0.0 /100 | #288 | Tragic 39.5% |
| Central Americans | 0.0 /100 | #289 | Tragic 39.4% |
| Immigrants | Haiti | 0.0 /100 | #290 | Tragic 39.3% |
| Dominicans | 0.0 /100 | #291 | Tragic 39.3% |
| Blacks/African Americans | 0.0 /100 | #292 | Tragic 39.1% |
| Nepalese | 0.0 /100 | #293 | Tragic 39.0% |
| Salvadorans | 0.0 /100 | #294 | Tragic 39.0% |
| Hondurans | 0.0 /100 | #295 | Tragic 38.9% |
| Cherokee | 0.0 /100 | #296 | Tragic 38.9% |