Inupiat vs Swiss In Labor Force | Age 35-44
COMPARE
Inupiat
Swiss
In Labor Force | Age 35-44
In Labor Force | Age 35-44 Comparison
Inupiat
Swiss
80.9%
IN LABOR FORCE | AGE 35-44
0.0/ 100
METRIC RATING
319th/ 347
METRIC RANK
84.2%
IN LABOR FORCE | AGE 35-44
17.4/ 100
METRIC RATING
209th/ 347
METRIC RANK
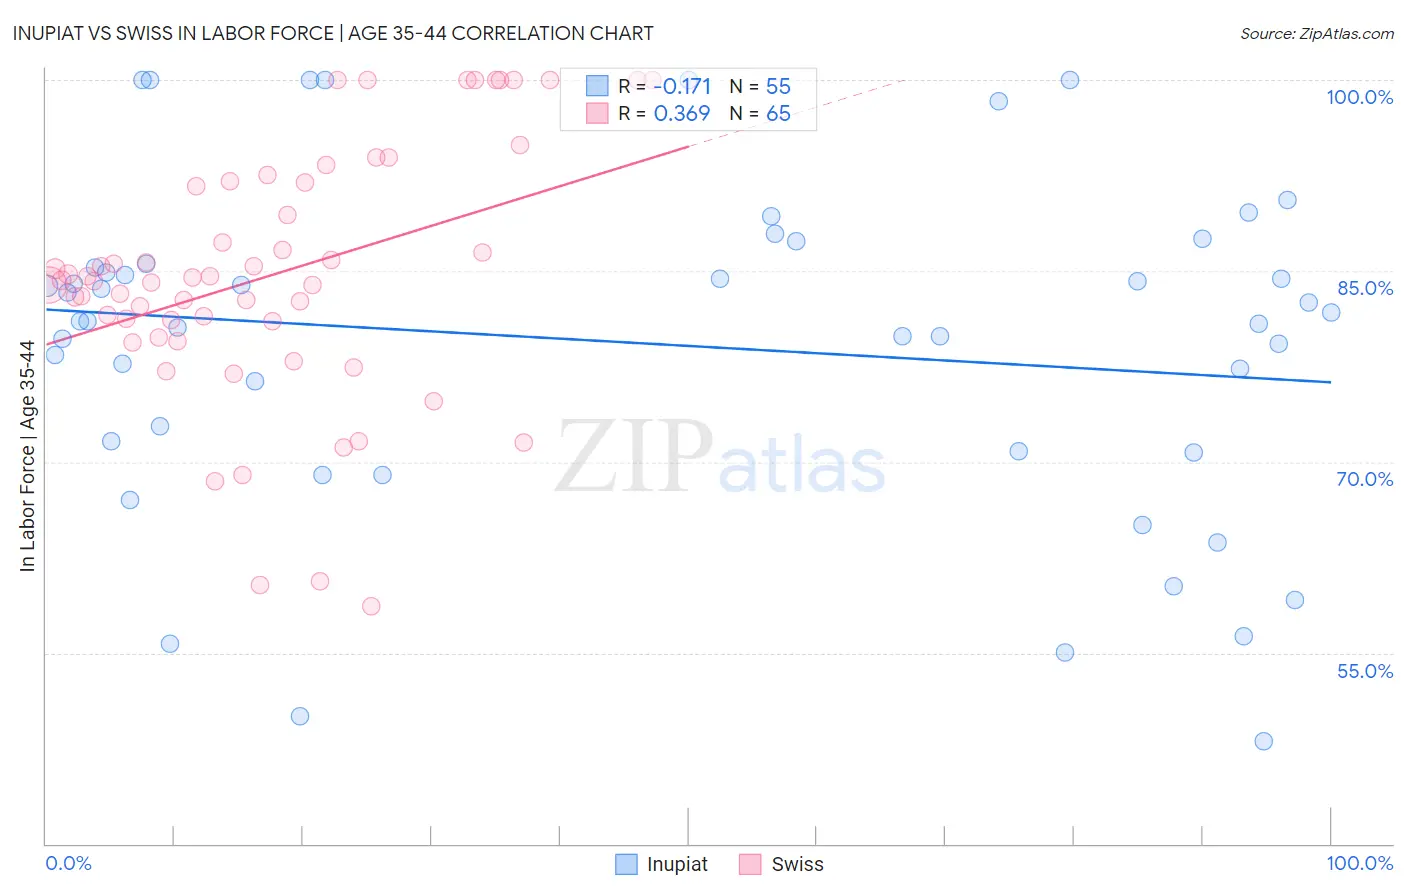
Inupiat vs Swiss In Labor Force | Age 35-44 Correlation Chart
The statistical analysis conducted on geographies consisting of 96,340,693 people shows a poor negative correlation between the proportion of Inupiat and labor force participation rate among population between the ages 35 and 44 in the United States with a correlation coefficient (R) of -0.171 and weighted average of 80.9%. Similarly, the statistical analysis conducted on geographies consisting of 464,764,529 people shows a mild positive correlation between the proportion of Swiss and labor force participation rate among population between the ages 35 and 44 in the United States with a correlation coefficient (R) of 0.369 and weighted average of 84.2%, a difference of 4.0%.
In Labor Force | Age 35-44 Correlation Summary
| Measurement | Inupiat | Swiss |
| Minimum | 48.1% | 58.7% |
| Maximum | 100.0% | 100.0% |
| Range | 51.9% | 41.3% |
| Mean | 79.3% | 84.7% |
| Median | 81.1% | 84.3% |
| Interquartile 25% (IQ1) | 70.8% | 80.4% |
| Interquartile 75% (IQ3) | 85.5% | 92.0% |
| Interquartile Range (IQR) | 14.7% | 11.6% |
| Standard Deviation (Sample) | 13.0% | 9.9% |
| Standard Deviation (Population) | 12.9% | 9.9% |
Similar Demographics by In Labor Force | Age 35-44
Demographics Similar to Inupiat by In Labor Force | Age 35-44
In terms of in labor force | age 35-44, the demographic groups most similar to Inupiat are Chickasaw (80.9%, a difference of 0.050%), Puerto Rican (80.7%, a difference of 0.33%), Paiute (80.6%, a difference of 0.40%), Alaskan Athabascan (81.3%, a difference of 0.44%), and Yaqui (80.5%, a difference of 0.51%).
| Demographics | Rating | Rank | In Labor Force | Age 35-44 |
| Alaska Natives | 0.0 /100 | #312 | Tragic 81.6% |
| Mexicans | 0.0 /100 | #313 | Tragic 81.6% |
| Cajuns | 0.0 /100 | #314 | Tragic 81.5% |
| Immigrants | Mexico | 0.0 /100 | #315 | Tragic 81.5% |
| Comanche | 0.0 /100 | #316 | Tragic 81.5% |
| Cherokee | 0.0 /100 | #317 | Tragic 81.4% |
| Alaskan Athabascans | 0.0 /100 | #318 | Tragic 81.3% |
| Inupiat | 0.0 /100 | #319 | Tragic 80.9% |
| Chickasaw | 0.0 /100 | #320 | Tragic 80.9% |
| Puerto Ricans | 0.0 /100 | #321 | Tragic 80.7% |
| Paiute | 0.0 /100 | #322 | Tragic 80.6% |
| Yaqui | 0.0 /100 | #323 | Tragic 80.5% |
| Choctaw | 0.0 /100 | #324 | Tragic 80.5% |
| Dutch West Indians | 0.0 /100 | #325 | Tragic 80.4% |
| Seminole | 0.0 /100 | #326 | Tragic 80.4% |
Demographics Similar to Swiss by In Labor Force | Age 35-44
In terms of in labor force | age 35-44, the demographic groups most similar to Swiss are Immigrants from North America (84.2%, a difference of 0.010%), New Zealander (84.1%, a difference of 0.010%), Immigrants from Canada (84.2%, a difference of 0.020%), Immigrants from Costa Rica (84.2%, a difference of 0.020%), and Laotian (84.2%, a difference of 0.020%).
| Demographics | Rating | Rank | In Labor Force | Age 35-44 |
| Immigrants | Uzbekistan | 22.8 /100 | #202 | Fair 84.2% |
| Immigrants | South Eastern Asia | 22.4 /100 | #203 | Fair 84.2% |
| Canadians | 19.9 /100 | #204 | Poor 84.2% |
| Immigrants | Canada | 19.6 /100 | #205 | Poor 84.2% |
| Immigrants | Costa Rica | 19.5 /100 | #206 | Poor 84.2% |
| Laotians | 19.0 /100 | #207 | Poor 84.2% |
| Immigrants | North America | 18.1 /100 | #208 | Poor 84.2% |
| Swiss | 17.4 /100 | #209 | Poor 84.2% |
| New Zealanders | 16.2 /100 | #210 | Poor 84.1% |
| Immigrants | Ecuador | 15.2 /100 | #211 | Poor 84.1% |
| Israelis | 14.0 /100 | #212 | Poor 84.1% |
| Bangladeshis | 13.7 /100 | #213 | Poor 84.1% |
| Immigrants | Barbados | 13.2 /100 | #214 | Poor 84.1% |
| Europeans | 12.2 /100 | #215 | Poor 84.1% |
| Nicaraguans | 12.1 /100 | #216 | Poor 84.1% |