Inupiat vs Tsimshian In Labor Force | Age 35-44
COMPARE
Inupiat
Tsimshian
In Labor Force | Age 35-44
In Labor Force | Age 35-44 Comparison
Inupiat
Tsimshian
80.9%
IN LABOR FORCE | AGE 35-44
0.0/ 100
METRIC RATING
319th/ 347
METRIC RANK
83.5%
IN LABOR FORCE | AGE 35-44
0.2/ 100
METRIC RATING
258th/ 347
METRIC RANK
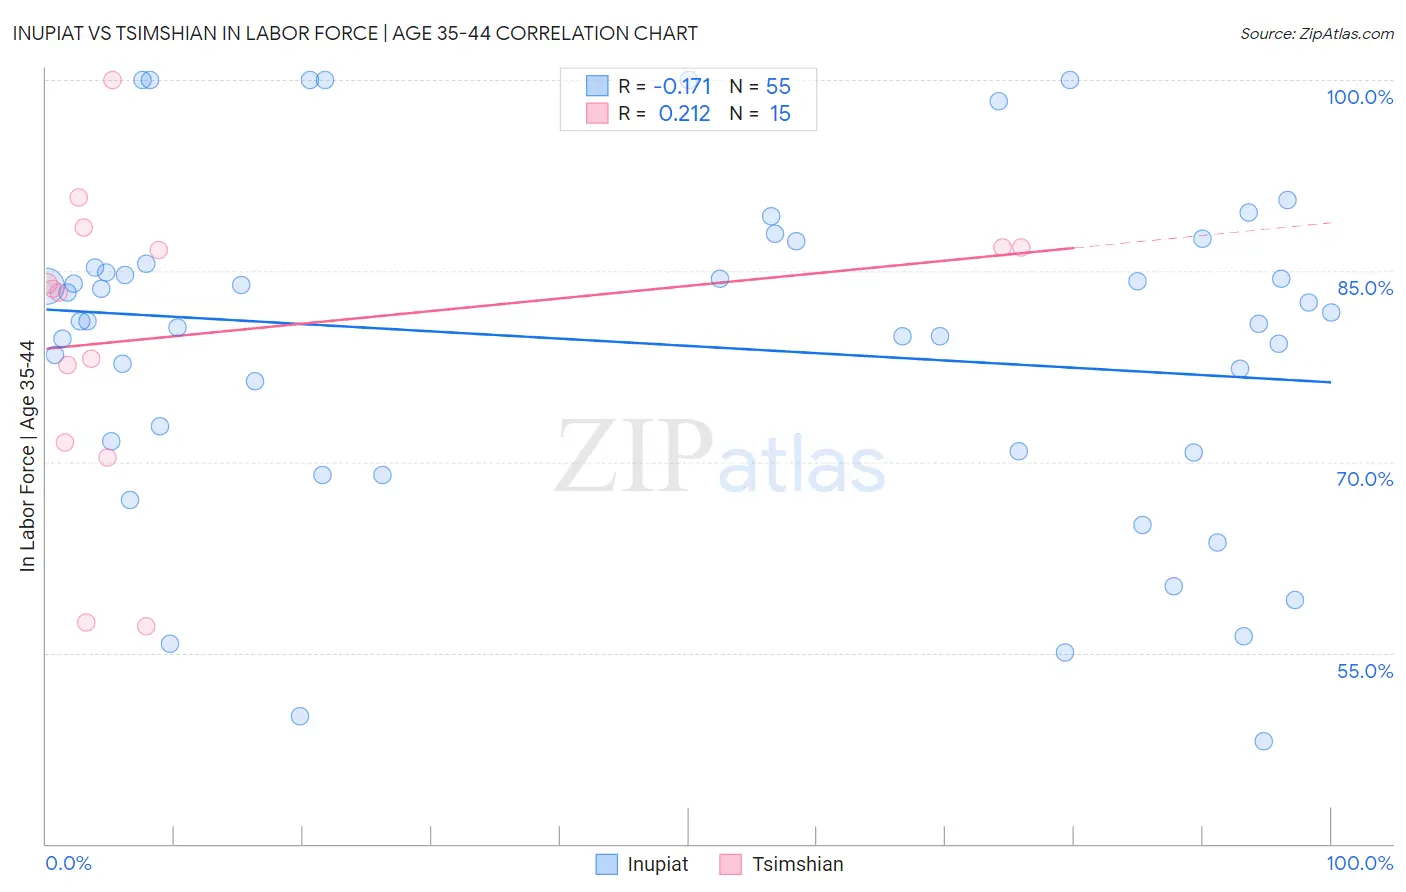
Inupiat vs Tsimshian In Labor Force | Age 35-44 Correlation Chart
The statistical analysis conducted on geographies consisting of 96,340,693 people shows a poor negative correlation between the proportion of Inupiat and labor force participation rate among population between the ages 35 and 44 in the United States with a correlation coefficient (R) of -0.171 and weighted average of 80.9%. Similarly, the statistical analysis conducted on geographies consisting of 15,626,462 people shows a weak positive correlation between the proportion of Tsimshian and labor force participation rate among population between the ages 35 and 44 in the United States with a correlation coefficient (R) of 0.212 and weighted average of 83.5%, a difference of 3.2%.
In Labor Force | Age 35-44 Correlation Summary
| Measurement | Inupiat | Tsimshian |
| Minimum | 48.1% | 57.1% |
| Maximum | 100.0% | 100.0% |
| Range | 51.9% | 42.9% |
| Mean | 79.3% | 80.2% |
| Median | 81.1% | 83.6% |
| Interquartile 25% (IQ1) | 70.8% | 71.6% |
| Interquartile 75% (IQ3) | 85.5% | 86.8% |
| Interquartile Range (IQR) | 14.7% | 15.2% |
| Standard Deviation (Sample) | 13.0% | 11.9% |
| Standard Deviation (Population) | 12.9% | 11.5% |
Similar Demographics by In Labor Force | Age 35-44
Demographics Similar to Inupiat by In Labor Force | Age 35-44
In terms of in labor force | age 35-44, the demographic groups most similar to Inupiat are Chickasaw (80.9%, a difference of 0.050%), Puerto Rican (80.7%, a difference of 0.33%), Paiute (80.6%, a difference of 0.40%), Alaskan Athabascan (81.3%, a difference of 0.44%), and Yaqui (80.5%, a difference of 0.51%).
| Demographics | Rating | Rank | In Labor Force | Age 35-44 |
| Alaska Natives | 0.0 /100 | #312 | Tragic 81.6% |
| Mexicans | 0.0 /100 | #313 | Tragic 81.6% |
| Cajuns | 0.0 /100 | #314 | Tragic 81.5% |
| Immigrants | Mexico | 0.0 /100 | #315 | Tragic 81.5% |
| Comanche | 0.0 /100 | #316 | Tragic 81.5% |
| Cherokee | 0.0 /100 | #317 | Tragic 81.4% |
| Alaskan Athabascans | 0.0 /100 | #318 | Tragic 81.3% |
| Inupiat | 0.0 /100 | #319 | Tragic 80.9% |
| Chickasaw | 0.0 /100 | #320 | Tragic 80.9% |
| Puerto Ricans | 0.0 /100 | #321 | Tragic 80.7% |
| Paiute | 0.0 /100 | #322 | Tragic 80.6% |
| Yaqui | 0.0 /100 | #323 | Tragic 80.5% |
| Choctaw | 0.0 /100 | #324 | Tragic 80.5% |
| Dutch West Indians | 0.0 /100 | #325 | Tragic 80.4% |
| Seminole | 0.0 /100 | #326 | Tragic 80.4% |
Demographics Similar to Tsimshian by In Labor Force | Age 35-44
In terms of in labor force | age 35-44, the demographic groups most similar to Tsimshian are Basque (83.6%, a difference of 0.020%), Immigrants from El Salvador (83.5%, a difference of 0.020%), Vietnamese (83.5%, a difference of 0.030%), Japanese (83.6%, a difference of 0.040%), and Immigrants from Dominica (83.5%, a difference of 0.040%).
| Demographics | Rating | Rank | In Labor Force | Age 35-44 |
| Salvadorans | 0.4 /100 | #251 | Tragic 83.6% |
| Immigrants | Guyana | 0.4 /100 | #252 | Tragic 83.6% |
| Lebanese | 0.4 /100 | #253 | Tragic 83.6% |
| Tongans | 0.4 /100 | #254 | Tragic 83.6% |
| Immigrants | Azores | 0.3 /100 | #255 | Tragic 83.6% |
| Japanese | 0.3 /100 | #256 | Tragic 83.6% |
| Basques | 0.3 /100 | #257 | Tragic 83.6% |
| Tsimshian | 0.2 /100 | #258 | Tragic 83.5% |
| Immigrants | El Salvador | 0.2 /100 | #259 | Tragic 83.5% |
| Vietnamese | 0.2 /100 | #260 | Tragic 83.5% |
| Immigrants | Dominica | 0.2 /100 | #261 | Tragic 83.5% |
| Immigrants | Congo | 0.2 /100 | #262 | Tragic 83.5% |
| Iroquois | 0.2 /100 | #263 | Tragic 83.5% |
| Scotch-Irish | 0.1 /100 | #264 | Tragic 83.5% |
| Central Americans | 0.1 /100 | #265 | Tragic 83.5% |