Immigrants from Denmark vs Swiss In Labor Force | Age 35-44
COMPARE
Immigrants from Denmark
Swiss
In Labor Force | Age 35-44
In Labor Force | Age 35-44 Comparison
Immigrants from Denmark
Swiss
84.3%
IN LABOR FORCE | AGE 35-44
33.7/ 100
METRIC RATING
189th/ 347
METRIC RANK
84.2%
IN LABOR FORCE | AGE 35-44
17.4/ 100
METRIC RATING
209th/ 347
METRIC RANK
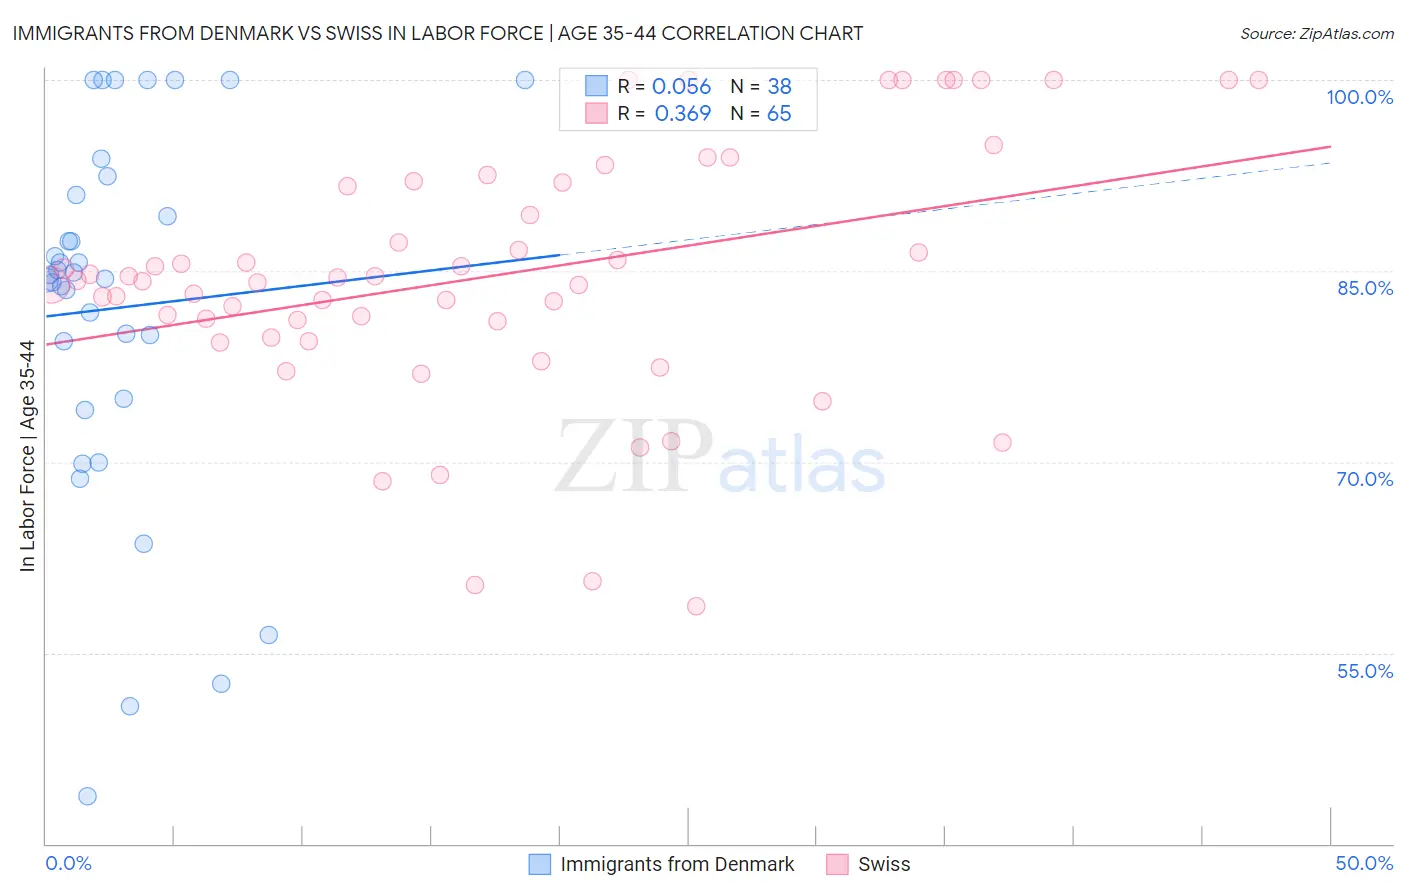
Immigrants from Denmark vs Swiss In Labor Force | Age 35-44 Correlation Chart
The statistical analysis conducted on geographies consisting of 136,414,422 people shows a slight positive correlation between the proportion of Immigrants from Denmark and labor force participation rate among population between the ages 35 and 44 in the United States with a correlation coefficient (R) of 0.056 and weighted average of 84.3%. Similarly, the statistical analysis conducted on geographies consisting of 464,764,529 people shows a mild positive correlation between the proportion of Swiss and labor force participation rate among population between the ages 35 and 44 in the United States with a correlation coefficient (R) of 0.369 and weighted average of 84.2%, a difference of 0.14%.
In Labor Force | Age 35-44 Correlation Summary
| Measurement | Immigrants from Denmark | Swiss |
| Minimum | 43.7% | 58.7% |
| Maximum | 100.0% | 100.0% |
| Range | 56.3% | 41.3% |
| Mean | 82.1% | 84.7% |
| Median | 84.6% | 84.3% |
| Interquartile 25% (IQ1) | 75.0% | 80.4% |
| Interquartile 75% (IQ3) | 91.0% | 92.0% |
| Interquartile Range (IQR) | 16.0% | 11.6% |
| Standard Deviation (Sample) | 14.4% | 9.9% |
| Standard Deviation (Population) | 14.2% | 9.9% |
Demographics Similar to Immigrants from Denmark and Swiss by In Labor Force | Age 35-44
In terms of in labor force | age 35-44, the demographic groups most similar to Immigrants from Denmark are Portuguese (84.3%, a difference of 0.010%), Immigrants from Philippines (84.2%, a difference of 0.040%), Immigrants from Vietnam (84.2%, a difference of 0.050%), Hungarian (84.2%, a difference of 0.050%), and Immigrants from Indonesia (84.2%, a difference of 0.060%). Similarly, the demographic groups most similar to Swiss are Immigrants from North America (84.2%, a difference of 0.010%), Immigrants from Canada (84.2%, a difference of 0.020%), Immigrants from Costa Rica (84.2%, a difference of 0.020%), Laotian (84.2%, a difference of 0.020%), and Canadian (84.2%, a difference of 0.030%).
| Demographics | Rating | Rank | In Labor Force | Age 35-44 |
| Immigrants | Denmark | 33.7 /100 | #189 | Fair 84.3% |
| Portuguese | 31.9 /100 | #190 | Fair 84.3% |
| Immigrants | Philippines | 27.9 /100 | #191 | Fair 84.2% |
| Immigrants | Vietnam | 27.4 /100 | #192 | Fair 84.2% |
| Hungarians | 26.8 /100 | #193 | Fair 84.2% |
| Immigrants | Indonesia | 25.7 /100 | #194 | Fair 84.2% |
| Immigrants | Caribbean | 25.7 /100 | #195 | Fair 84.2% |
| Immigrants | England | 25.0 /100 | #196 | Fair 84.2% |
| Immigrants | Western Europe | 24.7 /100 | #197 | Fair 84.2% |
| Ecuadorians | 24.0 /100 | #198 | Fair 84.2% |
| Syrians | 23.2 /100 | #199 | Fair 84.2% |
| Moroccans | 23.2 /100 | #200 | Fair 84.2% |
| British | 23.0 /100 | #201 | Fair 84.2% |
| Immigrants | Uzbekistan | 22.8 /100 | #202 | Fair 84.2% |
| Immigrants | South Eastern Asia | 22.4 /100 | #203 | Fair 84.2% |
| Canadians | 19.9 /100 | #204 | Poor 84.2% |
| Immigrants | Canada | 19.6 /100 | #205 | Poor 84.2% |
| Immigrants | Costa Rica | 19.5 /100 | #206 | Poor 84.2% |
| Laotians | 19.0 /100 | #207 | Poor 84.2% |
| Immigrants | North America | 18.1 /100 | #208 | Poor 84.2% |
| Swiss | 17.4 /100 | #209 | Poor 84.2% |