British vs Swiss In Labor Force | Age 35-44
COMPARE
British
Swiss
In Labor Force | Age 35-44
In Labor Force | Age 35-44 Comparison
British
Swiss
84.2%
IN LABOR FORCE | AGE 35-44
23.0/ 100
METRIC RATING
201st/ 347
METRIC RANK
84.2%
IN LABOR FORCE | AGE 35-44
17.4/ 100
METRIC RATING
209th/ 347
METRIC RANK
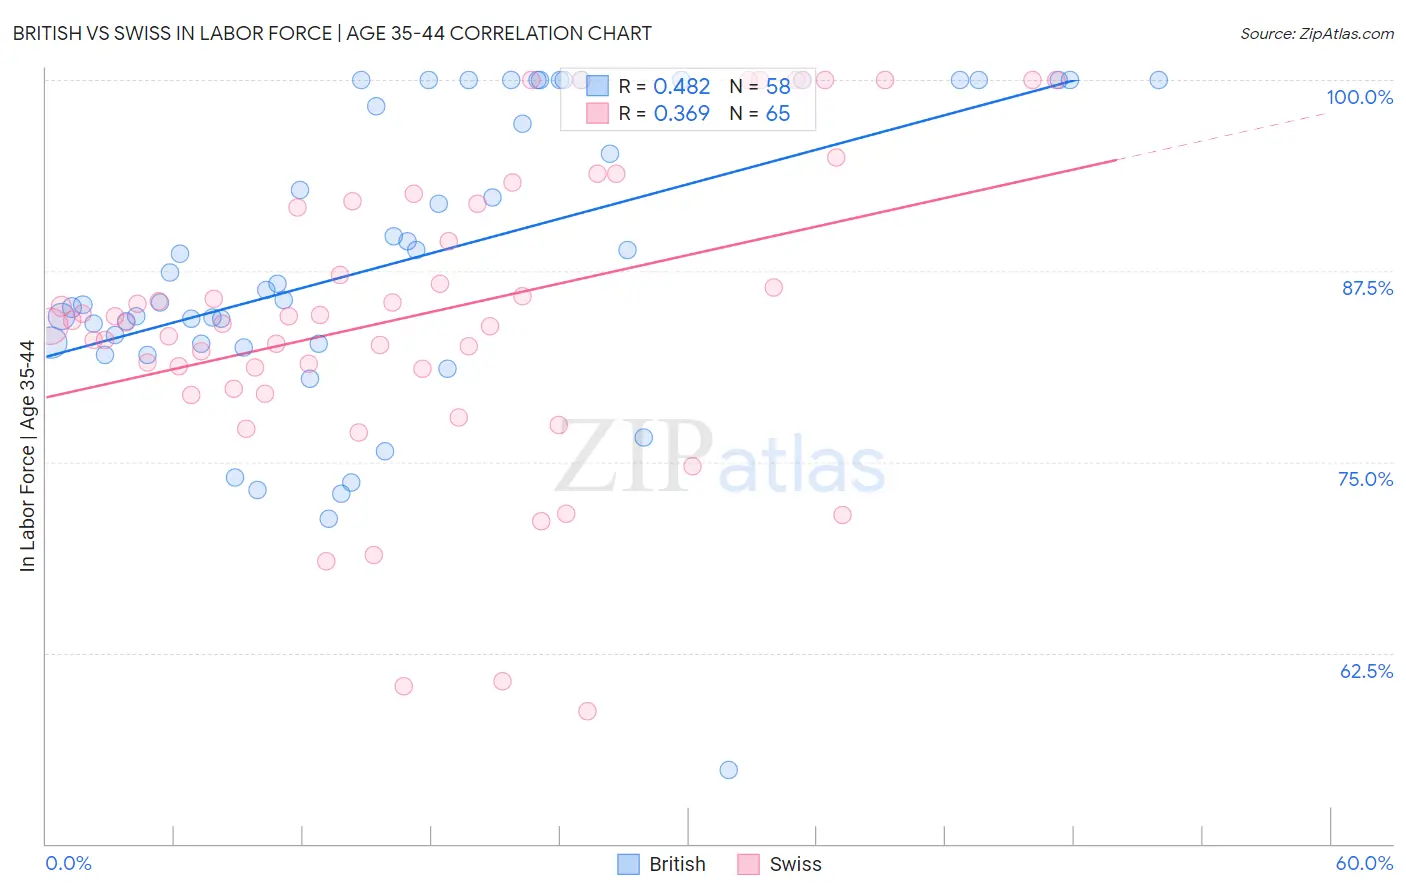
British vs Swiss In Labor Force | Age 35-44 Correlation Chart
The statistical analysis conducted on geographies consisting of 531,027,456 people shows a moderate positive correlation between the proportion of British and labor force participation rate among population between the ages 35 and 44 in the United States with a correlation coefficient (R) of 0.482 and weighted average of 84.2%. Similarly, the statistical analysis conducted on geographies consisting of 464,764,529 people shows a mild positive correlation between the proportion of Swiss and labor force participation rate among population between the ages 35 and 44 in the United States with a correlation coefficient (R) of 0.369 and weighted average of 84.2%, a difference of 0.060%.
In Labor Force | Age 35-44 Correlation Summary
| Measurement | British | Swiss |
| Minimum | 54.8% | 58.7% |
| Maximum | 100.0% | 100.0% |
| Range | 45.2% | 41.3% |
| Mean | 88.2% | 84.7% |
| Median | 86.4% | 84.3% |
| Interquartile 25% (IQ1) | 82.8% | 80.4% |
| Interquartile 75% (IQ3) | 100.0% | 92.0% |
| Interquartile Range (IQR) | 17.2% | 11.6% |
| Standard Deviation (Sample) | 9.9% | 9.9% |
| Standard Deviation (Population) | 9.8% | 9.9% |
Demographics Similar to British and Swiss by In Labor Force | Age 35-44
In terms of in labor force | age 35-44, the demographic groups most similar to British are Syrian (84.2%, a difference of 0.0%), Moroccan (84.2%, a difference of 0.0%), Immigrants from Uzbekistan (84.2%, a difference of 0.0%), Ecuadorian (84.2%, a difference of 0.010%), and Immigrants from South Eastern Asia (84.2%, a difference of 0.010%). Similarly, the demographic groups most similar to Swiss are Immigrants from North America (84.2%, a difference of 0.010%), New Zealander (84.1%, a difference of 0.010%), Immigrants from Canada (84.2%, a difference of 0.020%), Immigrants from Costa Rica (84.2%, a difference of 0.020%), and Laotian (84.2%, a difference of 0.020%).
| Demographics | Rating | Rank | In Labor Force | Age 35-44 |
| Immigrants | Caribbean | 25.7 /100 | #195 | Fair 84.2% |
| Immigrants | England | 25.0 /100 | #196 | Fair 84.2% |
| Immigrants | Western Europe | 24.7 /100 | #197 | Fair 84.2% |
| Ecuadorians | 24.0 /100 | #198 | Fair 84.2% |
| Syrians | 23.2 /100 | #199 | Fair 84.2% |
| Moroccans | 23.2 /100 | #200 | Fair 84.2% |
| British | 23.0 /100 | #201 | Fair 84.2% |
| Immigrants | Uzbekistan | 22.8 /100 | #202 | Fair 84.2% |
| Immigrants | South Eastern Asia | 22.4 /100 | #203 | Fair 84.2% |
| Canadians | 19.9 /100 | #204 | Poor 84.2% |
| Immigrants | Canada | 19.6 /100 | #205 | Poor 84.2% |
| Immigrants | Costa Rica | 19.5 /100 | #206 | Poor 84.2% |
| Laotians | 19.0 /100 | #207 | Poor 84.2% |
| Immigrants | North America | 18.1 /100 | #208 | Poor 84.2% |
| Swiss | 17.4 /100 | #209 | Poor 84.2% |
| New Zealanders | 16.2 /100 | #210 | Poor 84.1% |
| Immigrants | Ecuador | 15.2 /100 | #211 | Poor 84.1% |
| Israelis | 14.0 /100 | #212 | Poor 84.1% |
| Bangladeshis | 13.7 /100 | #213 | Poor 84.1% |
| Immigrants | Barbados | 13.2 /100 | #214 | Poor 84.1% |
| Europeans | 12.2 /100 | #215 | Poor 84.1% |